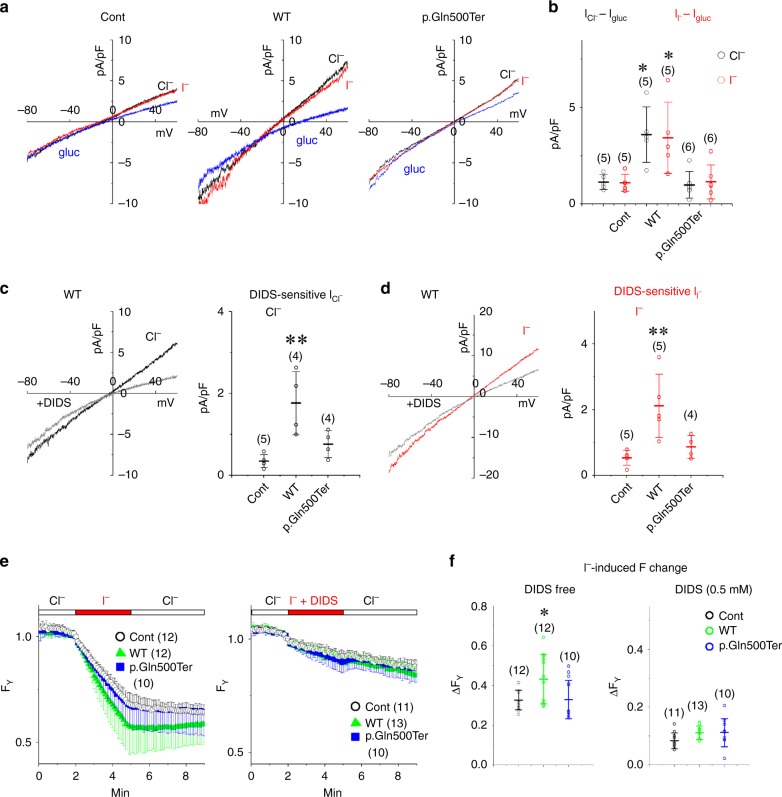
Fig. 6.
Electrophysiological and optophysiological analyses of the ion transport function of SLC26A7. WT, but not p.Gln500Ter SLC26A7 functions as an I− transporter. a Current–voltage relationships. Shown are the current traces recorded during the ramp pulse protocol (−80 to 60 mV for 400 ms) from cells transfected with YFP alone (Cont) or with YFP and SLC26A7 constructs. The currents were recorded in different bath solutions (NaCl, black; NaI red; Na-glu, blue). b Summary of Cl− and I− current amplitudes (ICl−–Iglu and II−–Iglu). Black and red circles represent the amplitudes of ICl−–Iglu and II−–Iglu at 29–31 mV in each cell, respectively. Numbers of cells are indicated in parentheses. *P < 0.05 (WT against control: P = 0.0130 (ICl−–Igl) and 0.0207 (II−–Igl), Tukey’s test). c, d Inhibition of the Cl− and I− current by DIDS. In the left panels, the Cl− and I− current traces (black and red lines) are shown in the presence or absence of 0.5 mM DIDS (grey lines). Black and red circles in the right panels show the amplitudes of the DIDS-sensitive ICl− and II− densities in each cell, respectively. Numbers of cells are indicated in parentheses. **P < 0.01 (WT against control: P = 0.0030 (NaCl) and 0.0055 (NaI), Tukey’s test). e The accumulation of I−. Shown are time lapse changes of the normalised fluorescence intensity of YFP-HQ/IL (FY) in cells expressing the mutant YFP-HQ/IL alone (open circles, con) or in the presence of WT (green triangles) or mutant SLC26A7 (blue squares). The NaI bath solution was perfused for 3 min, as indicated by red bars on traces. DIDS (0.5 mM) was included in the NaI solution to inhibit the WT SLC26A7 channel (right panel). Numbers of cells are indicated in parentheses. f Summary of the FY change. Circles represent changes in FY at 3 min after the NaI perfusion. Numbers of cells are indicated in parentheses. *P < 0.05 (WT against control: P = 0.0288, Tukey’s test)

