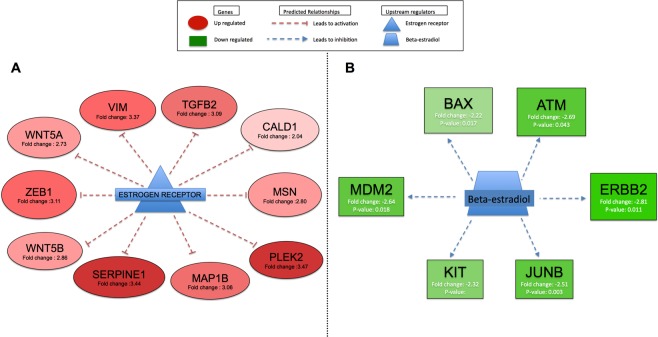
Figure 6.
Upstream regulatory analysis (URA) of differentially expressed genes (DEGs) predicted the estrogen receptor and beta-estradiol (P < 0.05) to be inhibited in HCV29 cells co-culture for 24 h with S. haematobium eggs. Panel A. Significantly upregulated genes are shown in red. These genes, negatively regulated (T-symbol) by the estrogen receptor, were found to be upregulated in HCV29 cells co-cultured with S. haematobium eggs for 24 hours; red dashed lines indicate that these genes were activated. Therefore, the URA analysis significantly predicted the estrogen receptor as an inhibited upstream regulator of this set of genes in this dataset. Panel B. Significantly downregulated genes are shown in green. These genes, positively regulated (arrow) by beta-estradiol, were found to be downregulated in HCV29 cells co-cultured with S. haematobium eggs for 24 hours; blue dashed lines indicate that these genes were inhibited in our dataset. Therefore, the URA analysis significantly predicted beta-estradiol as an inhibited upstream regulator of this set of genes in the dataset.

