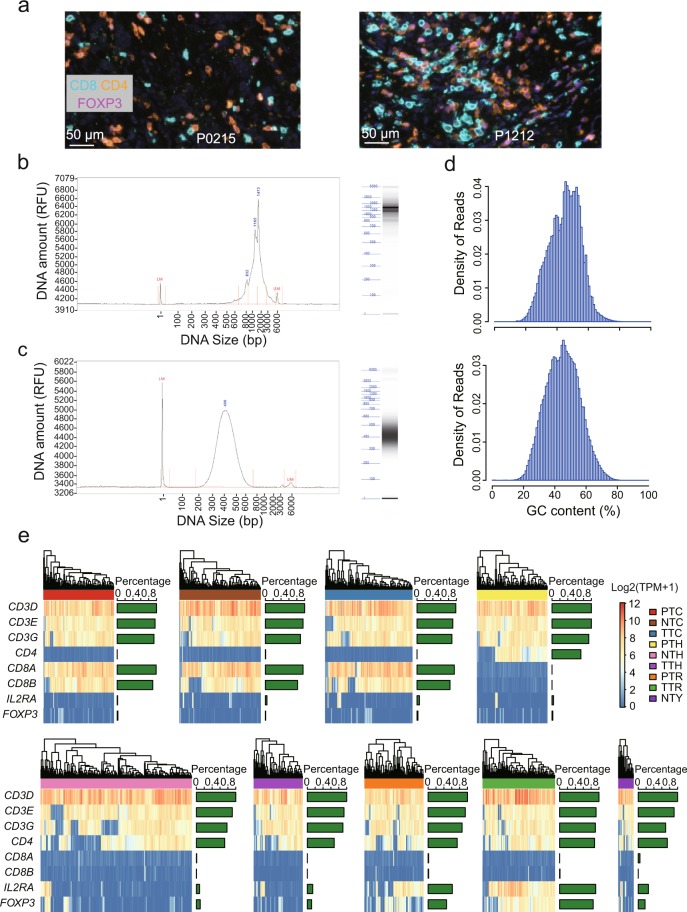
Fig. 5.
Quality assessment of single cell RNA-seq data. (a) OpalTM multi-colour IHC staining to validate the existence of T cells in CRC tumours (exemplified by P0215 and P1212). (b) One representative example of cDNA size distribution derived from tumour of P0309. (c) One representative fragmentation profile of sequencing library after tagmentation prepared from pooled amplicons produced by PCR amplification of cDNA from samples of P0413. (d) The densities of GC content per sequence for two representative samples of P1212 and P1228. (e) Heatmaps demonstrating the expression levels of classic marker in each T cell subtypes. The right-sided barplots showed the percentages of cell with the expression of corresponding genes (TPM > 0). RFU, relative fluorescence unit.

