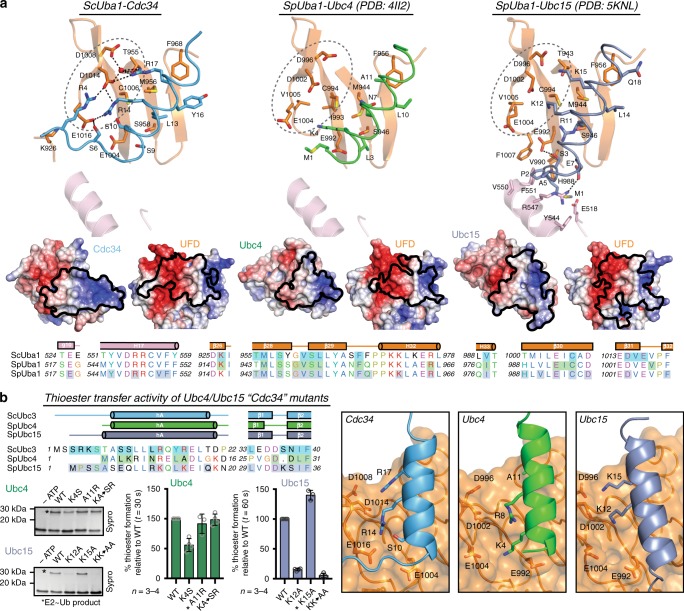
Fig. 4.
The E1/Cdc34-binding mode is achieved via a unique network of contacts. a Top, interface between E2 and Uba1 UFD with involved residues shown as sticks for Cdc34 (left), Ubc4 (middle), and Ubc15 (right); colored as in Fig. 3. Dashed circles indicate UFD acidic patch binding region. Middle, open-book electrostatic surfaces of the E2/UFD interface with UFD footprint mapped onto E2 (left) and E2 footprint mapped onto UFD (right) for each E2 above. Bottom, sequence alignment of ScUba1 and SpUba1 AAD and UFD with corresponding secondary structure cartoon shown above sequence. Shaded boxes indicate Uba1 residues that interact with the corresponding E2: Cdc34 (blue), Ubc4 (green), and Ubc15 (gray). b Top left, sequence alignment of E2 UFD/AAD-interacting region with secondary structure cartoon and interacting residues shaded as in a. Bottom left, E1-E2 thioester transfer assays of the indicated mutants for Ubc4 and Ubc15. Data are represented by mean ± SD with representative replicates labeled to the left and individual replicates shown as gray circles. Biochemical assays have four independent replicates, unless indicated by an asterisk when there are three replicates. Source data are provided as a Source Data file. Right, interface between UFD acidic patch and E2 hA residues corresponding to Cdc34 Arg14/Arg17

