Fig. 5.
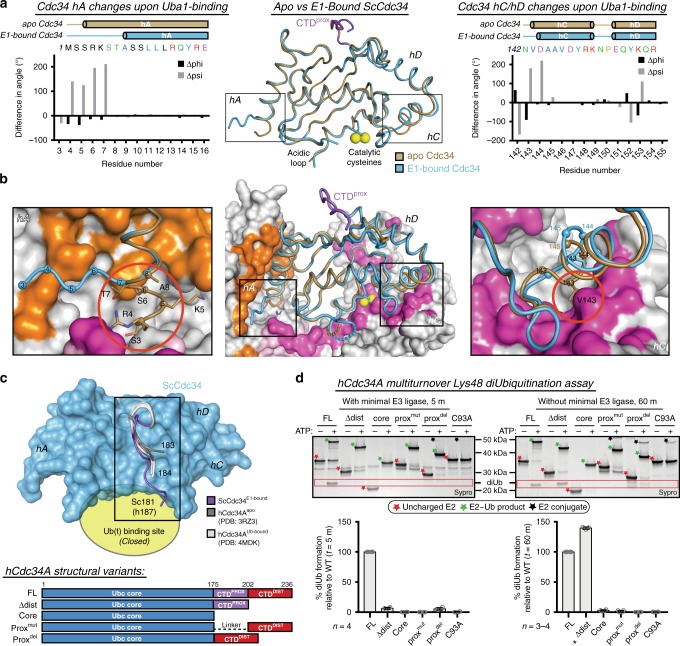
Structural changes in key Cdc34 elements accompany E1 binding. a Middle, apo (tan) and E1-bound (blue) Cdc34 superimposed using the conserved core of the protein. hA and hC conformational changes are highlighted by black boxes. Differences in phi and psi angles between Cdc34E1-bound and Cdc34apo are shown as bar graphs for hA (left) and hC/hD (right). Cartoons above the graphs indicate secondary structure boundaries for Cdc34apo (tan) and Cdc34E1-bound (blue). b Middle, Cdc34apo superimposed as in a onto Uba1–Cdc34 complex. Uba1 is colored as in Fig. 1 and Cdc34 conformational changes are highlighted as in a. Zoomed in view of Cdc34 hA (left) and hC (right) with clashes between Uba1 and Cdc34apo indicated by red circles. c Top, top-down view of CTDprox of ScCdc34E1-bound (purple), hCdc34Aapo (PDB:3RZ3, dark gray), and hCdc34AUb-bound (PDB:4MDK, light gray) superimposed as worms with ScCd34 core shown as blue surface, and closed Ub(t)-binding site indicated by a yellow oval. Bottom, cartoon schematic of hCdc34A global mutants used for K48-diUb assays. d K48-diUb assays for the indicated mutants with (left) and without (right) minimal E3 ligase. Data are represented by mean ± SD with individual replicates shown as gray circles. Biochemical assays have four independent replicates, unless indicated by an asterisk when there are three replicates. Representative replicates are labeled above and annotated with stars for clarity. diUb product is indicated by a label and red box. Source data are provided as a Source Data file

