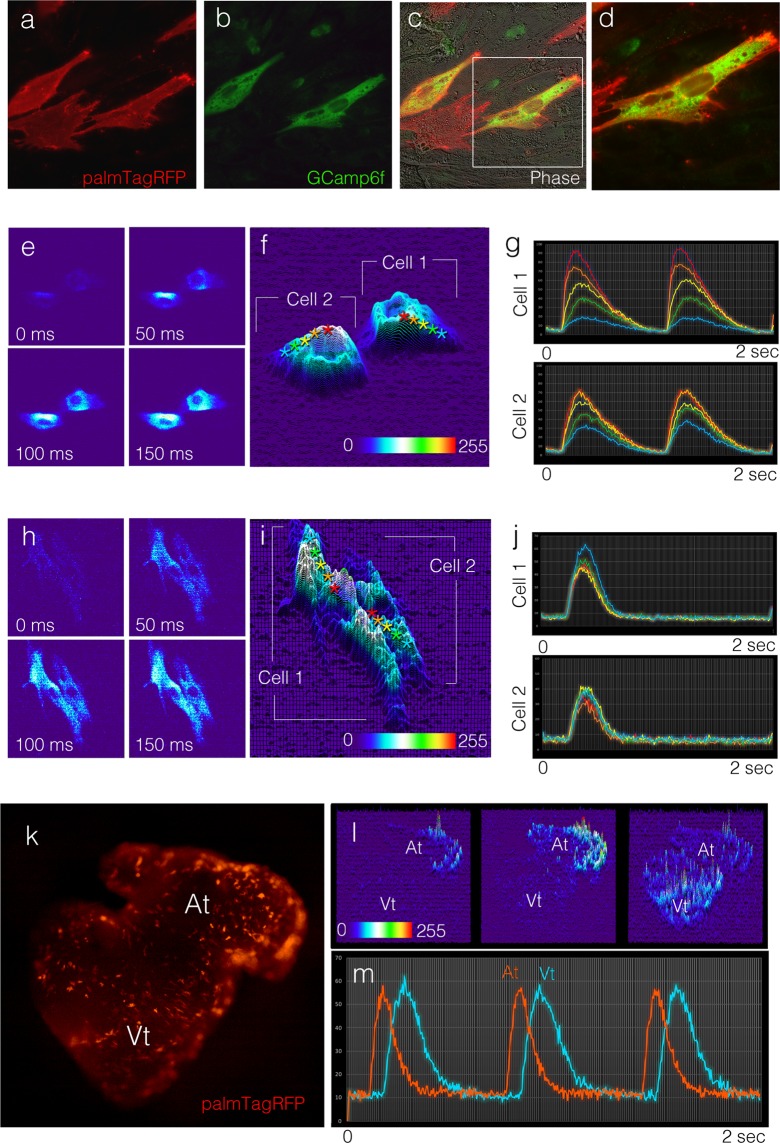
Figure 6.
Real-time analysis of cellular function. (A) PalmTagRFP localization in cells isolated from a heart cotransfected with a membrane reporter and the calcium reporter GCamp6F. ((B) GCamp6f localization (detected with an antiGFP antibody) in cells from (A). (C) Images from (A) and B) overlaid on a phase contrast image. (D) Higher magnification image of cell from (A-C) demonstrating GCamp6f protein distribution in transfected cell. (E) Time series of GCamp6f intensity in a pair of transfected cells isolated from an E4 heart. (F) Plot of calcium transient intensity at point of maximal activity in cells from (E). G) Calcium transient traces (dF/F0) measured from areas denoted by asterisks from (F). (H-I) As in (E-G), for cells isolated from an E9 heart. Note both the shape of the cells and the pattern of calcium transient activation has changed. (K) Image of a heart cotransfected with palmTagRFP and GCamp6F. (L) Time series of calcium transient intensity in the heart from (K) (see also Sup Movie 1). (M) Calcium transient traces (dF/F0) from an atrial (orange) and ventricular (blue) cell from (K).

