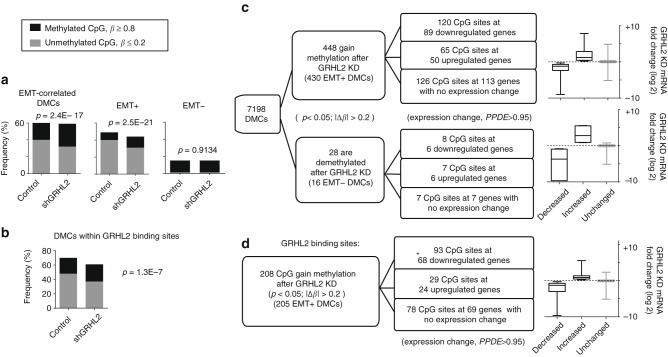
Fig. 2.
Gain in CpG methylation at epithelial–mesenchymal transition (EMT)-correlated differentially methylated CpG sites (DMCs) and GRHL2 binding sites following GRHL2 knockdown. a Bar graphs depict the frequency of methylated (β ≥ 0.8) and unmethylated (β ≤ 0.2) EMT-correlated DMCs (left), EMT+ DMCs (middle) and EMT− DMCs (right) in OVCA429 control vs. shGRHL2 cells. The p values of Fisher’s exact tests are shown for each group. b Bar graph indicates a slight increase (%) in methylated CpG (β ≥ 0.8) and a slight decrease (%) in unmethylated CpG (β ≤ 0.2) at DMCs within GRHL2 binding sites in GRHL2-knockdown cells, compared to control. The p value of Fisher’s exact test is shown. c Flow charts show the number of EMT-correlated DMCs that gain or lose methylation (p < 0.05; |∆β| > 0.2) after GRHL2 knockdown, with or without associated gene expression change. Box plots (right) depict the average expression log2 fold changes (messenger RNA (mRNA)) of the genes in each group after GRHL2 knockdown. d Flow chart shows the number of GRHL2 binding sites that gain or lose CpG methylation (p < 0.05; |∆β| > 0.2) after GRHL2 knockdown, with or without associated gene expression change. *This group is significantly enriched (93 vs. 29), based on Fisher’s exact test (p = 0.0427). Box-plot (right) depicts the average expression log2 fold changes (mRNA) of the genes in each group after GRHL2 knockdown. Error bars are ±s.e.m

