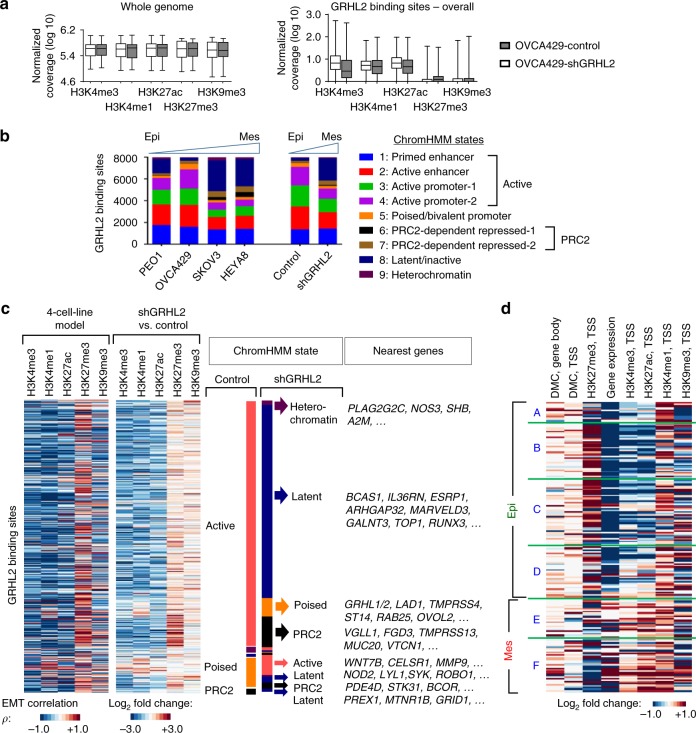
Fig. 5.
Histone modifications and chromatin states at GRHL2 binding sites and epithelial–mesenchymal transition (EMT) genes following GRHL2 knockdown. a Box plots showing chromatin immunoprecipitation-sequencing (ChIP-seq) results (normalized log10 coverage) of H3K4me3, H3K4me1, H3K27ac, H3K27me3, and H3K9me3 at the whole-genome level (left) and GRHL2 binding sites (right) in OVCA429 control and shGRHL2 cells. The band within the box represents the median and the whiskers indicate the minimum to the maximum. b Bar chart shows the number of GRHL2 binding sites with nine different ChromHMM states in the four-cell-line EMT model (PEO1, OVCA429, SKOV3, HEYA8) and GRHL2-knockdown EMT model (OVCA429 control vs. shGRHL2). c Heatmaps showing GRHL2 binding sites with differential histone H3 modifications in correlation with EMT represented by the four-cell-line model (left, Pearson’s correlation ρ), and in the GRHL2-knockdown model (right, log2 fold change). GRHL2 binding sites have lower levels of H3K4me3, H3K4me1, H3K27ac (blue) and higher levels of H3K27me3 (red) in EMT score-high and shGRHL2 cells, compared to EMT score-low and OVCA429 control cells, respectively. Diagram next to heatmaps indicates ChromHMM states and the nearest genes of the respective GRHL2 binding sites in OVCA429 control and shGRHL2 cells. d Heatmap depicts differential levels (log2 fold change) of methylation at differentially methylated CpG sites (DMCs), histone H3 marks, and gene expression among 195 EMT signature genes (shown in Fig. 4c) in OVCA429 shGRHL2 vs. control cells

