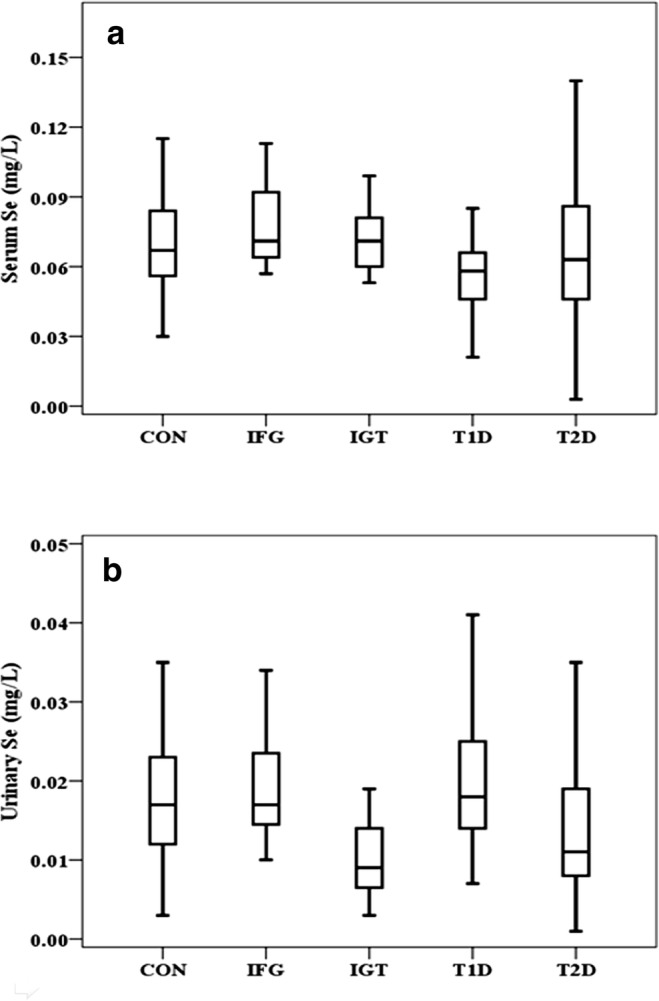
Fig. 1.

Levels of Se in healthy control, IFG, IGT, T1D, and T2D groups. Boxplots display the extremes, the upper and lower quartiles, and the median of the maximum difference in healthy controls, IFG, IGT, and T2D groups. The median for each dataset is indicated by the centerline, and the first and third quartiles are presented by the edges of the area, which is known as the interquartile range (IQR). P value of serum Se levels was < 0.05 between healthy control group and IFG, IGT, T1D, and T2D groups (a). P value of urinary Se levels was < 0.05 between healthy control group and IFG, IGT, T1D, and T2D groups (b)
