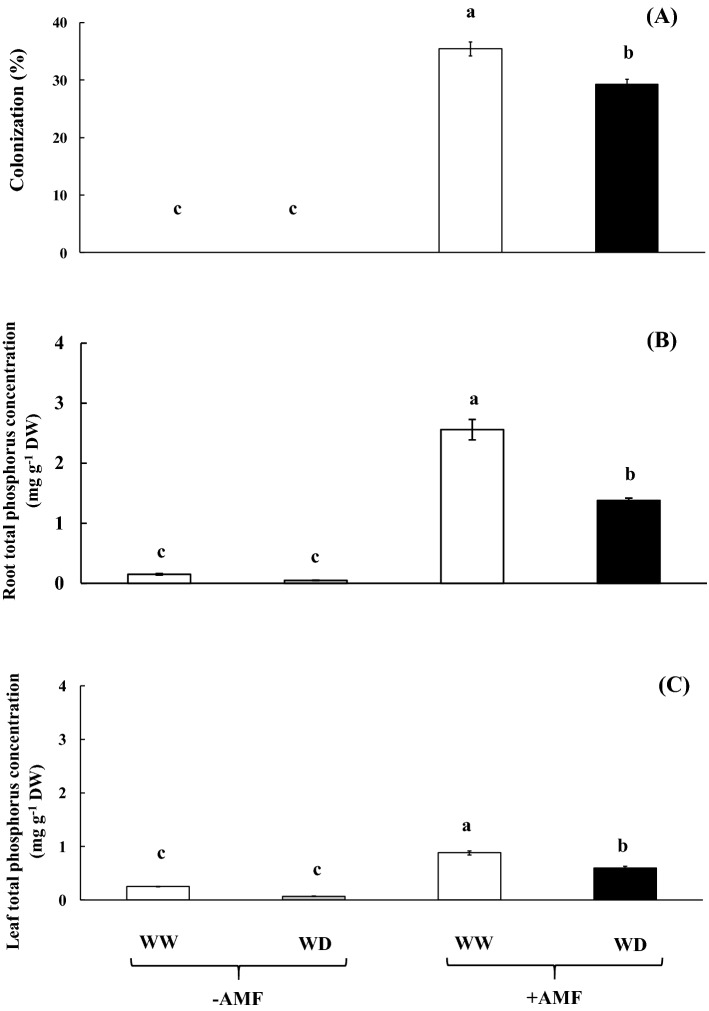
Fig. 1.
AMF colonization a in the root tissue, and total phosphorus concentration in root (b) and leaf tissues c of rice cv. ‘Hom Nil’ plants inoculated with AMF and subsequently exposed to water deficit conditions for 7 days. Error bars represent ± SE. Different letters in each bar show significant difference at ≤ 0.05 according to Tukey’s HSD

