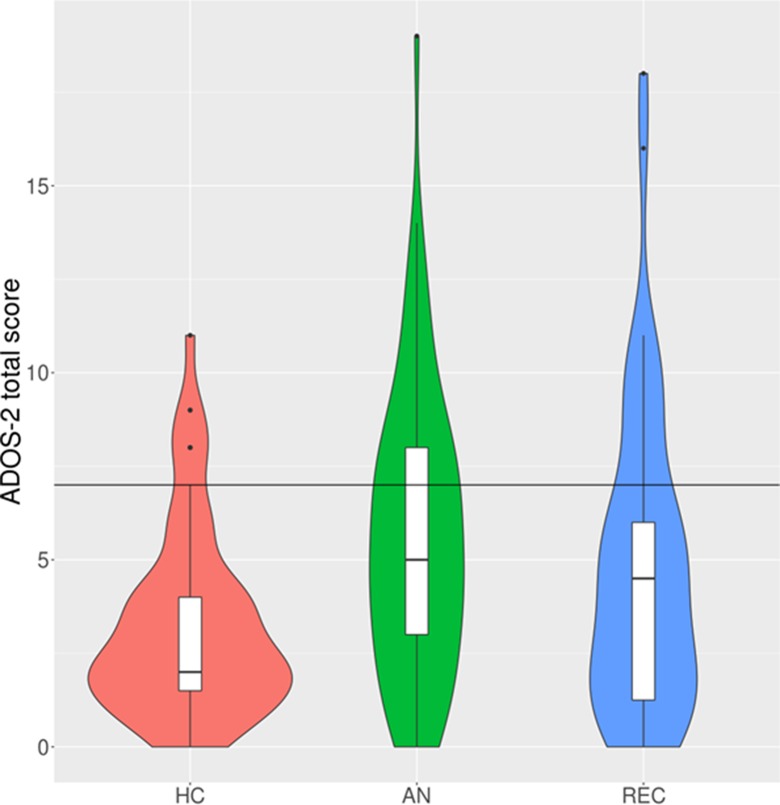
Figure 2.
Violin and box plots of ADOS-2 total scores under the new algorithm. N.B. The black horizontal line indicates the cut-off for autism diagnosis (total score of 7 or higher). HC, healthy control; AN, anorexia nervosa; REC, recovered from anorexia nervosa. The violin plots demonstrate the density of the scores within each group. The box plots show the median, interquartile range, minimum, and maximum scores within each group.

