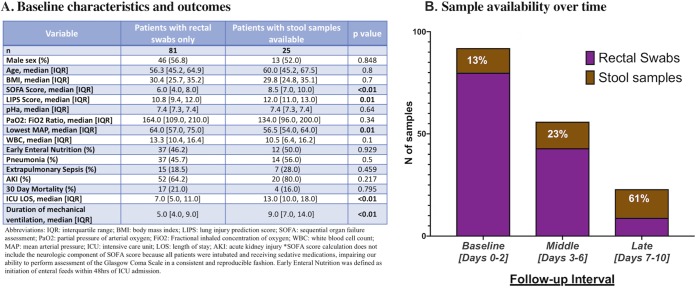
FIG 1.
Cohort characteristics and sample type availability over time. (A) Table listing baseline characteristics and clinical outcomes of patients with rectal swabs only versus patients with stool samples available. P values are from Wilcoxon tests for continuous and Fisher’s exact tests for categorical variables (highlighted in bold when significant [P < 0.05]). (B) Stacked-bar graph of numbers of rectal swabs versus stool samples at each time interval (purple for rectal swabs and brown for stool samples). The proportion of stool samples available at each time interval is shown with white characters.

