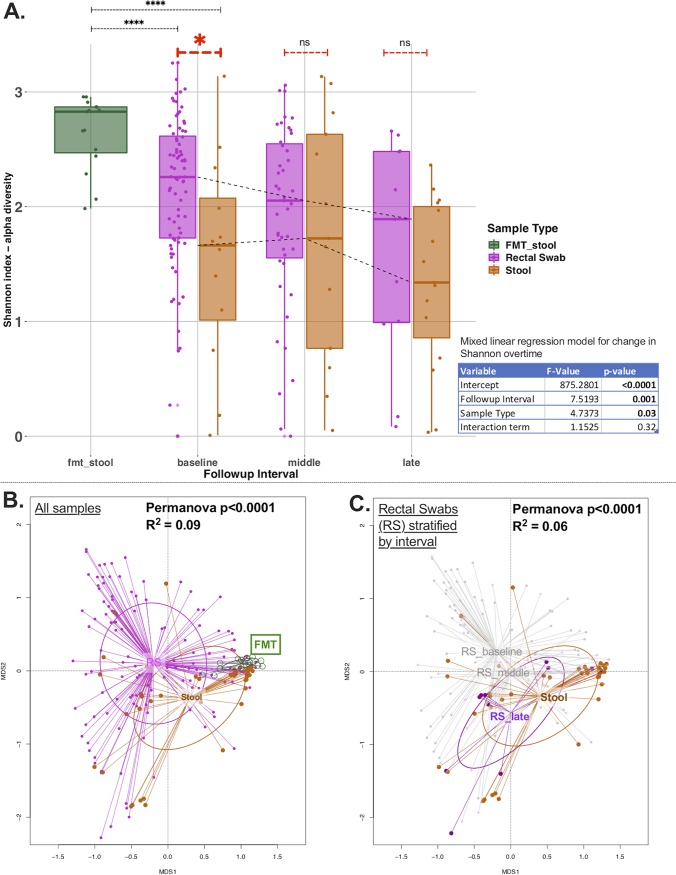
FIG 2.
Alpha-diversity and beta-diversity comparisons show markedly different representations of the gut microbiome by sample type. (A) Alpha-diversity analyses by sample type and follow-up interval showed that rectal swabs had higher Shannon index values than stool samples at the baseline time point by a Wilcoxon test (P < 0.02) but not at subsequent follow-up intervals. Both rectal swabs and stool samples had significantly lower alpha-diversity than FMT samples (P < 0.0001) at baseline and at subsequent follow-up intervals. There was significant decline of Shannon index values over time, adjusting for sample type with a mixed linear regression model with random patient intercepts (shown in table inset). (B) Beta-diversity analyses: principal-coordinate analyses of Bray-Curtis dissimilarity indices between rectal swabs and stool samples. A greater distance between samples indicates greater dissimilarity. In the left panel, all available samples are stratified by sample type, showing significant differences between rectal swabs and stool samples (permutational multivariate analysis of variance [Permanova] P = 0.0001). FMT samples appeared compositionally more similar to stool samples than to rectal swabs from critically ill patients. In panel C, stratified analyses by study follow-up interval for rectal swabs show that rectal swabs in the late interval were more similar to stool samples (overlapping ellipsoids) than to rectal swabs obtained earlier (baseline or middle interval).

