
FIG 4.
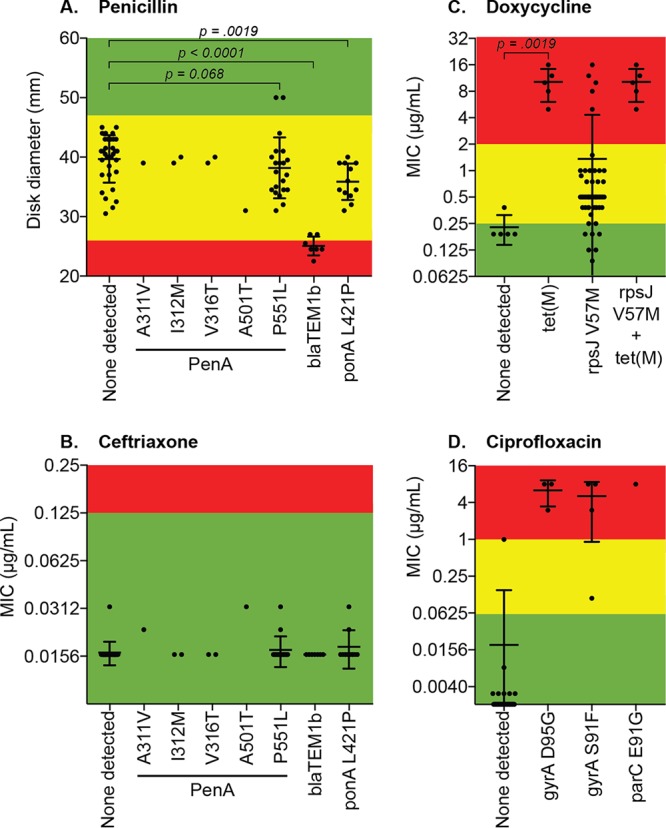
Correlation of resistance phenotypes with known resistance determinants in N. gonorrhoeae isolates. Whole-genome sequencing was performed on all clinical isolates (n = 64), and common antimicrobial resistance determinants were identified. Each graph shows the zone of inhibition or MIC for a drug with the corresponding resistance determinants displayed on the x axis. Only determinants that were present in one or more isolates are shown; if an isolate harbored more than one resistance determinant, it is displayed for each determinant. Colors denote breakpoints for each antibiotic: green, susceptible; yellow, intermediate; red, resistant. P values show the results of Mann-Whitney U tests between selected groups. (A) Penicillin; (B) ceftriaxone (results for cefuroxime and cefixime were similar); (C) doxycycline (results for tetracycline were virtually identical); (D) ciprofloxacin (results for delafloxacin and gemifloxacin were similar).