Figure 1.
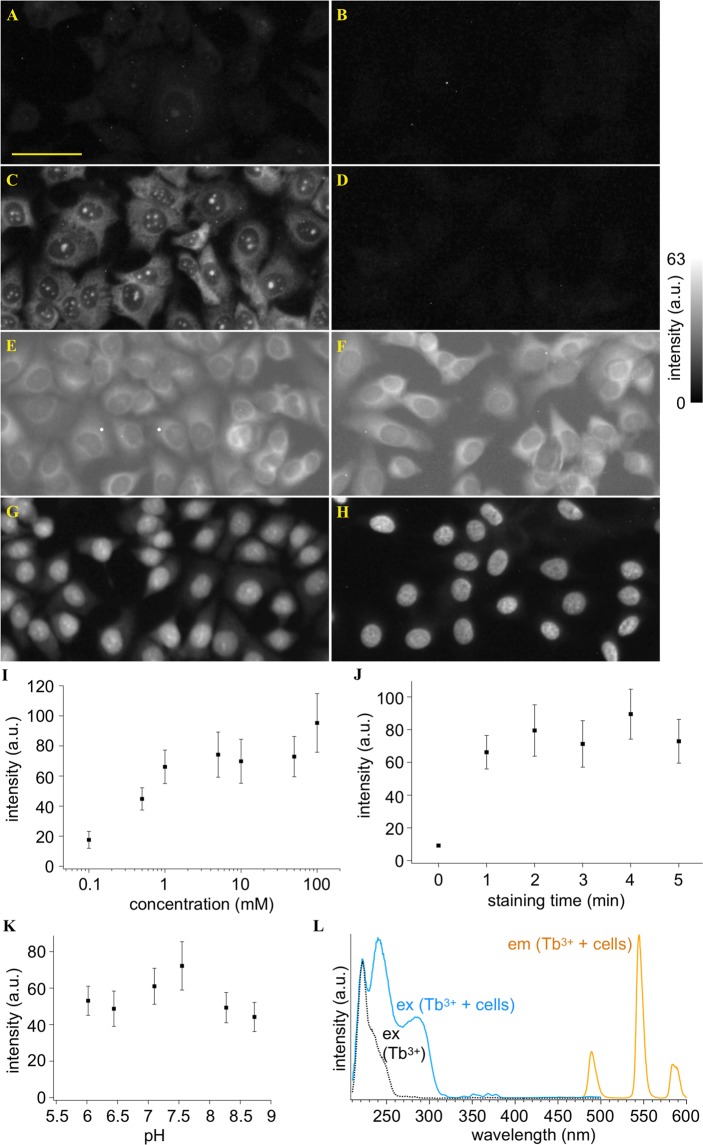
DUV-excitation fluorescence of MCF-7 cells stained with and without Tb3+. (A–G) Fluorescence images of the cells treated with (A) a Tb3+ solution of H2O, (B) an H2O solution without Tb3+, (C) a Tb3+ solution of D2O, and (D) a D2O solution without Tb3+. For comparison, fluorescence images of the cells stained with (E) Rhodamine B, (F) eosin Y, (G) PI, and (H) Hoechst 33342 are also shown. Scale bar corresponds to 50 µm. All the images were converted to 8-bits grayscale images from the RGB images measured with an RGB camera. Maximal values of brightness in (D–H) were adjusted so that difference in the fluorescence intensity distributions could be easily found. Brightness in (A–C) were adjusted to be the same as that in (D) so that the remarkably high fluorescence intensity of Tb3+ in D2O could be recognized. (I–K) Dependencies of fluorescence intensity on (I) Tb3+ concentration, (J) treatment period, and (K) solution pH. Squares and error bars indicate means and standard deviations of fluorescence intensity for 100 cells under each condition. (L) Excitation and emission spectra of the cells immersed in the 10 mM Tb3+ solution of D2O, as well as an excitation spectrum of the 10 mM Tb3+ solution of D2O. The excitation wavelength was 285 nm. The emission wavelength detected for measuring the excitation spectra was adjusted to 546 nm. The Tb3+ concentration, treatment period, and solution pH were 50 mM, 5 min, and 7, respectively, unless noted.

