Figure 2.
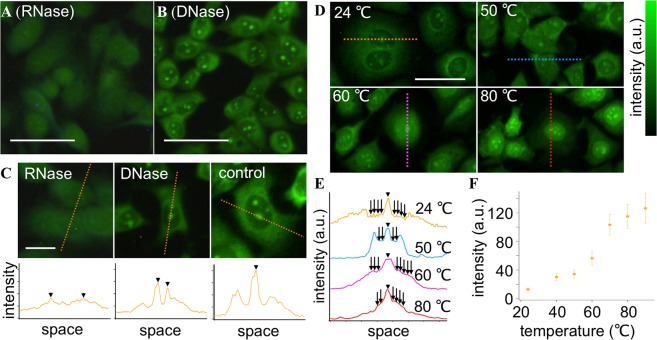
Cytochemical and spectroscopic analyses for revealing Tb3+-stained molecules in the cells. (A,B) DUV-excitation fluorescence images of cells treated with (A) RNase and (B) DNase and subsequently stained with Tb3+. (C) Line profiles of the Tb3+ fluorescence intensity for RNase-treated, DNase-treated, and non-treated (control) cells. (D–F) Temperature-dependent Tb3+ staining results. Representative fluorescence images of the cells stained with Tb3+ at 24, 50, 60, and 80 °C are shown in (D). Brightness was adjusted for all the images so that fluorescence distribution can be clearly seen. Line profiles of raw data (meaning the fluorescence images without the brightness adjustment) are shown in (E). Arrowheads indicate nucleoli. Arrows indicate nucleus regions. The nucleoplasm intensity was analyzed for 100 cells at each temperature and the results are shown in (F). Error bars indicate standard deviations. The excitation wavelength was 285 nm. The Tb3+ concentration, treatment period, and solution pH were adjusted to 50 mM, 5 min, and 7, respectively, unless noted. Scale bars in (A,B,D) and (C) correspond to 20 and 50 µm, respectively.

