Figure 3.
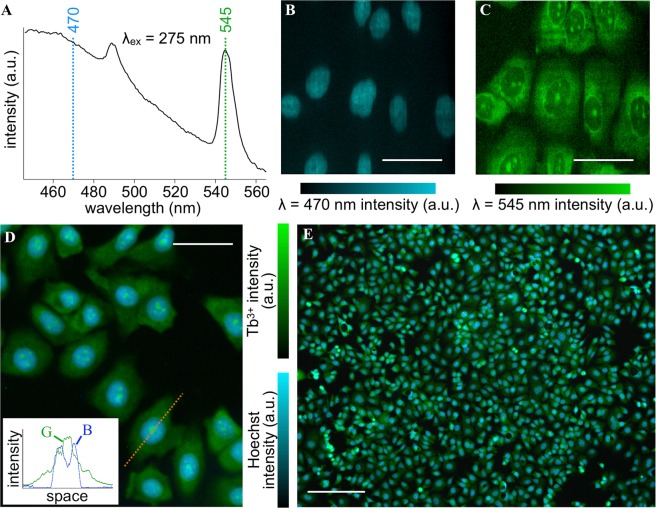
Dual-color fluorescence imaging of the cells stained with Tb3+ and Hoechst. (A) Representative fluorescence spectra of the cells stained with Hoechst + Tb3+. The excitation wavelength was 275 nm. (B,C) Representative images reconstructed with intensity at (B) λ = 470 nm (Hoechst) and (C) λ = 545 nm (Tb3+), as results of fluorescence hyperspectral imaging. (D,E) Wide-field imaging of the cells stained with Hoechst + Tb3+. The excitation wavelength was 285 nm. A zoom-in and large field-of-view images are shown in (D,E), respectively. Line profiles are shown in the inset of (D). G and B indicate green and blue channels of the color camera, respectively. The Tb3+ concentration, treatment period, and solution pH were adjusted to 50 mM, 5 min, and 7, respectively. Scale bars in (B–D) and (E) correspond to 50 and 200 µm, respectively. The concentration of Hoechst was 10 µg/ml.

