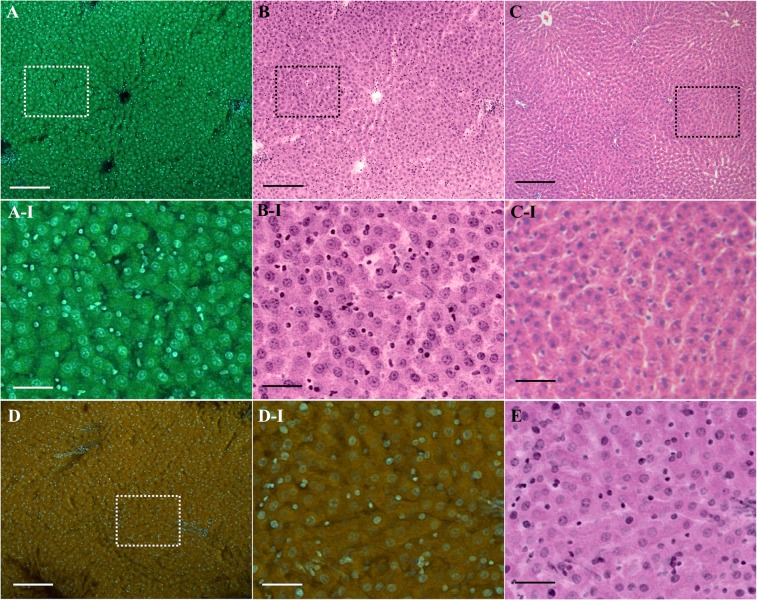
Figure 4.
Unsliced tissue imaging with a wide-field DUV-excitation fluorescence microscope. (A) An adult rat liver tissue stained with the D2O solution containing Tb3+ (50 mM) and Hoechst (20 µg/ml). The excitation wavelength, treatment period, and solution pH were adjusted to 285 nm, 3 min, and 7, respectively. The virtual H&E images generated from the fluorescence images shown in (A). (C) An H&E stain image of an adult rat liver. (D) For comparison, the fluorescence image measured with the conventional staining protocol using Hoechst 33342 and Rhodamine B is shown. The regions indicated in (A–D) by dotted squares are magnified in (A-I–D-I) respectively. (E) The virtual H&E image corresponding to (D-I). Scale bars correspond to 200 and 50 µm for the large field-of-view (A–D) and magnified (A-I,B-I,C-I,D-I,E) images, respectively. For the fluorescence images shown in (A,D,A-I,D-I) unsharp masking was applied. The correspondent original images are shown in Fig. S2. The relatively large cells are hepatocytes, while the small cells seen in the fluorescence and virtual H&E images can be sinusoidal cells such as epithelial cells, Kupffer cells, and stellate cells.

