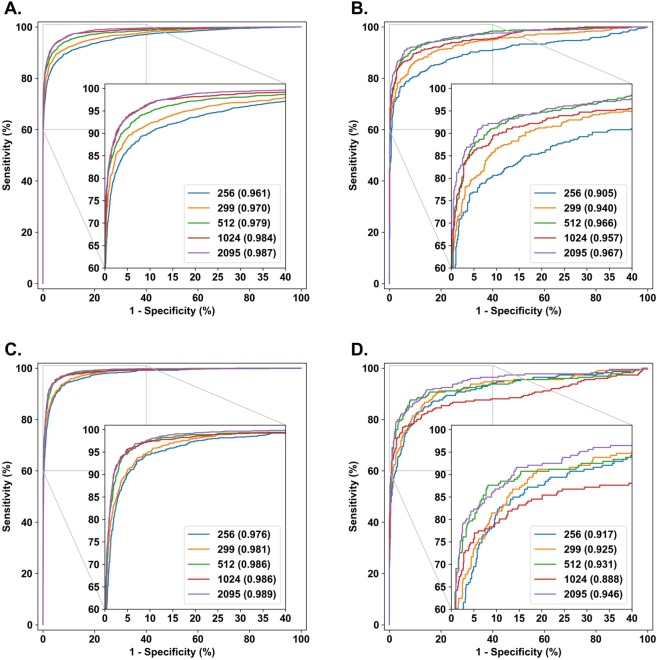
Figure 1.
ROC curves for nonreferable vs. referable diabetic retinopathy in classifying nonreferable vs. referable macular edema on primary validation set and Messidor set. (A) NRDR/RDR classification on the primary validation set (N = 7118). (B) NRDR/RDR classification on Messidor set (N = 1200). (C) NRDME/RDME classification on the primary validation set (N = 7304). (D) NRDME/RDME classification on Messidor set (N = 1200). Referable vs. nonreferable diabetic retinopathy shown in (A,B) and referable diabetic macular edema shown in C and D. ROC curve is shown for input image sizes of 256 × 256, 299 × 299, 512 × 512, 1024 × 1024 and 2095 × 2095 pixels. AUC shown in parentheses in the legend.

