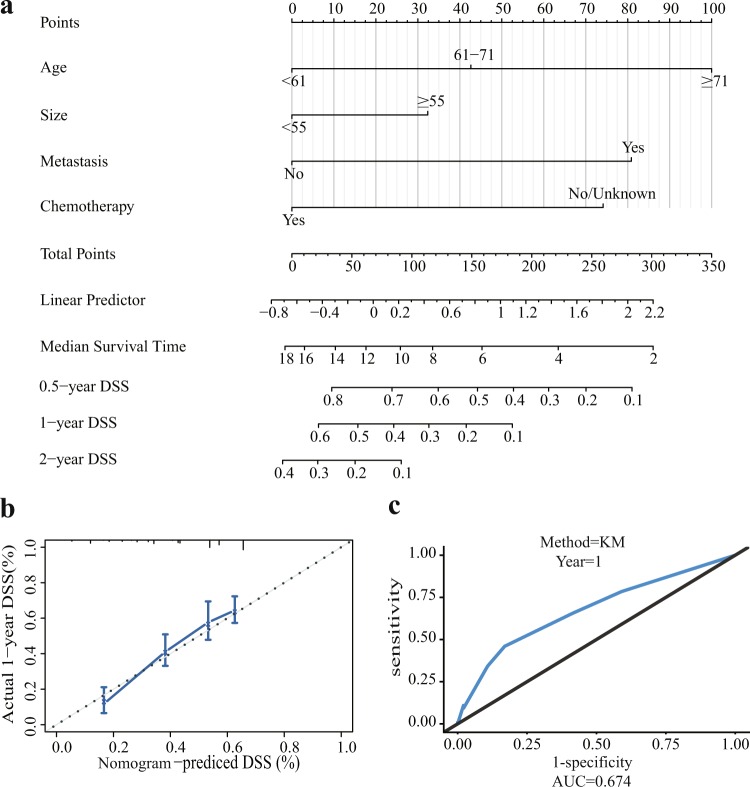
Figure 5.
Nomogram, the internal calibration curve, and the ROC curve. (a) Nomogram for predicting the 0.5-, 1-, and 2-year disease-specific survival probabilities in patients with primary GSM following craniotomy. (b) The internal calibration curve for predicting 1-year disease-specific survival probability is displayed. The nomogram-predicted probability of DSS is plotted on the x-axis, and the actual probability of DSS is plotted on the y-axis. (c) The ROC curve shows the sensitivity and specificity of disease-specific survival prediction by the nomogram.

