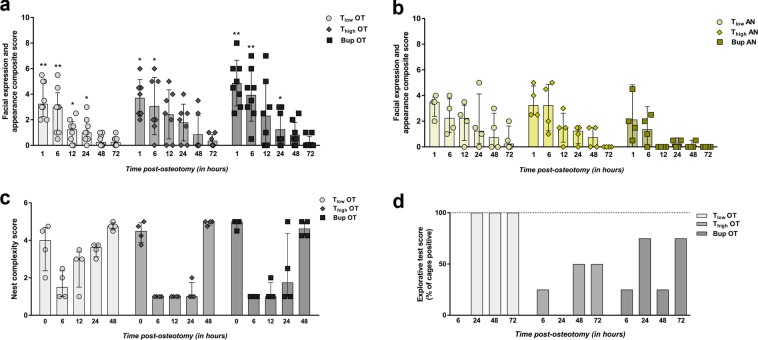
Figure 3.
General wellbeing parameters are reduced in osteotomy groups and influenced by anesthesia and analgesia. (a,b) Mice were transferred individually to observation boxes, allowed to acclimate for 1 min and were observed for 3 min. Facial expression and appearance composite score was assessed in the OT (a) and AN (b) groups at 1, 6, 12, 24, 48 and 72 h post-osteotomy/post-anesthesia. DW groups were continuously scored with 0. Measured scores are shown as scatter dot plot and bar with median ± interquartile range for n = 8 (OT) and n = 4 (AN). Wilcoxon signed rank test was used to determine statistical significance towards the initial score (hypothetical median = 0; exact p-values are listed in Supplementary Table S4); p-values are indicated with *p < 0.05, **p < 0.01 and ***p < 0.001. (c) Nest complexity score of the OT groups are depicted for 0, 6, 12, 24 and 48 h post-osteotomy. Data are shown as scatter dot plot and bar with median ± interquartile range for n = 4 (cages). (d) The explorative test score is depicted for the OT groups as mean – percentage of cages that were determined positive for n = 4 (cages). Nest complexity and explorative test scores are provided in Supplementary Fig. S2.

