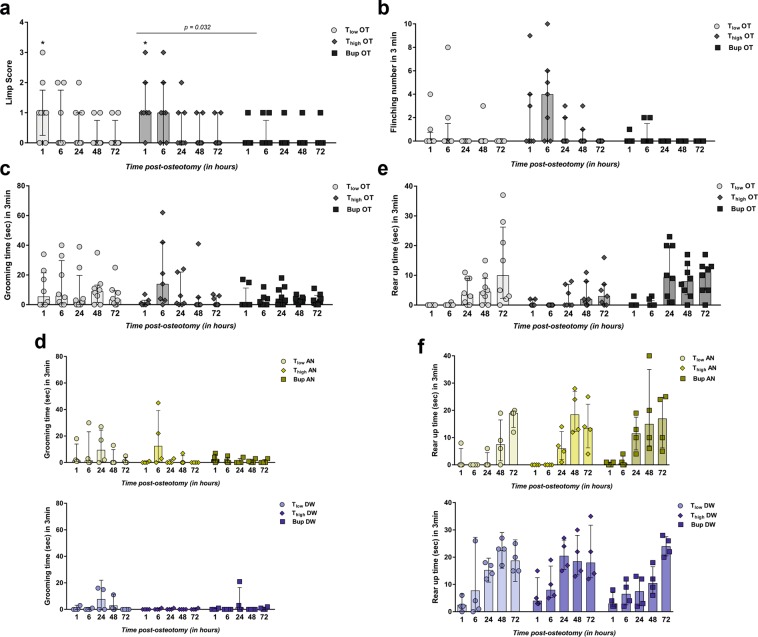
Figure 4.
Higher concentrations of Tramadol do not further ameliorate model-specific pain-related parameters. (a) The limp score included limping and dragging. Only the scores for the OT groups are shown in the graph as AN and DW groups showed no positive score. Measured scores are shown as scatter dot plot and bar with median ± interquartile range for n = 8. Wilcoxon signed rank test was used to determine statistical significance towards the initial score (hypothetical median = 0; exact p-values are listed in Supplementary Table S5); p-values are indicated with *p < 0.05, **p < 0.01 and ***p < 0.001. For group differences, Kruskal-Wallis test with Dunn’s multiple comparison test for selected pairs (time point) was performed; adjusted p-values are indicated. (b) Number of flinching per 3 min observation are depicted for OT groups (no flinching was observed in AN and DW groups). (c,d) Graphs show grooming time during 3 min for OT (c) and AN and DW (d) groups. (e,f) Rear up time during 3 min is shown for OT (e) and AN and DW (f) groups. (b–f) Data are shown as scatter dot plot and bar with median ± interquartile range for n = 8 (OT) and n = 4 (AN, DW).

