Figure 7.
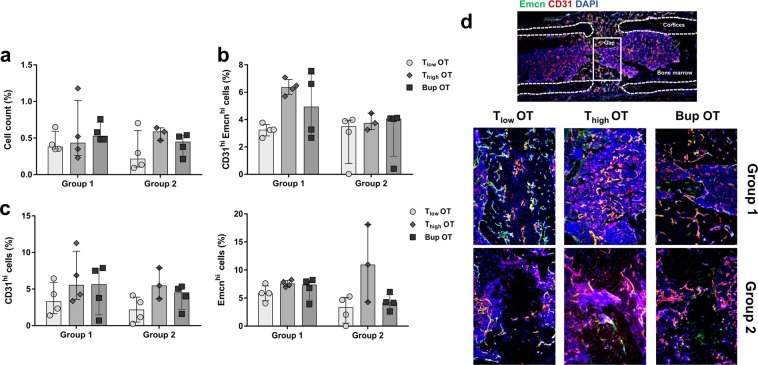
Vessel formation is comparable between treatment groups. Immunofluorescence staining was performed to measure (a) the cell count, (b) the number of double-positive cells (CD31hi Emcnhi) and (c) the number of CD31hi and Emcnhi cells alone in the osteotomy gap. Data was normalized to the total analyzed area and are shown as scatter dot plot and bar with median ± interquartile range n = 3–4. (d) Exemplary immunofluorescence vessel staining (CD31 = red, Emcn = green, DAPI = blue). Scale bars = 200 µm.

