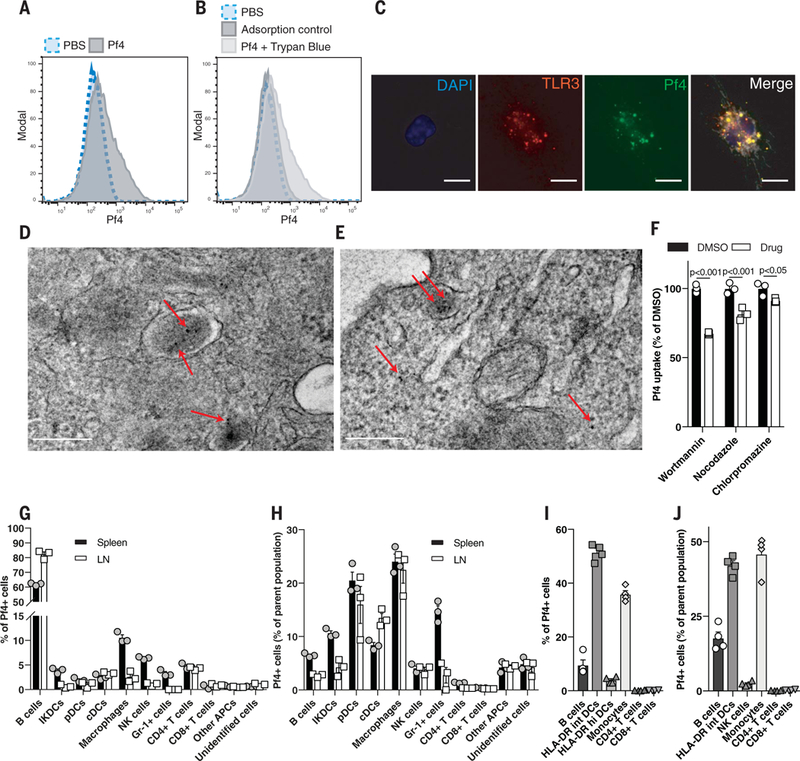
Fig. 5. Pf phage is actively taken up by immune cells through endocytic pathways.

(A) Flow cytometric analysis of fluorescently labeled Pf4 uptake by BMDCs. (B) Flow cytometric analysis of BMDCs stimulated with fluorescently labeled Pf4 at 4°C (adsorption control) or with extracellular fluorescence quenched with trypan blue. (C) Immunofluorescence staining of TLR3 in BMDMs stimulated with fluorescently labeled Pf4. Scale bar: 10 μm. (D and E)Transmission electron microscopydepictinggold-abeled Pf4 present in intracellular lysosomes and the cytosol in BMDCs after 3 hours (D) and 24 hours (E) of Pf4 stimulation. Scale bars: 200 nm. (F) Pf4 uptake by BMDCs treated with various endocytosis inhibitors before Pf4 stimulation. Statistics: two-tailed Student’s t test. DMSO, dimethyl sulfoxide. (G) Composition by cell type of mouse leukocytes isolated from spleen or lymph node positive for fluorescently labeled Pf4. (H) Percentage of individual immune cell populations within mouse spleen and lymph nodes that took up Pf4. (I) Composition by cell type of human PBMCs that have taken up fluorescently labeled Pf4. (J) Percentage of individual immune cellpopulationswithin humanPBMCs that took up Pf. (A), (B), and (F) to (J) are each representative of n ≥ 3 experiments. Graphs depict mean with SEM of n ≥ 3 replicates.
