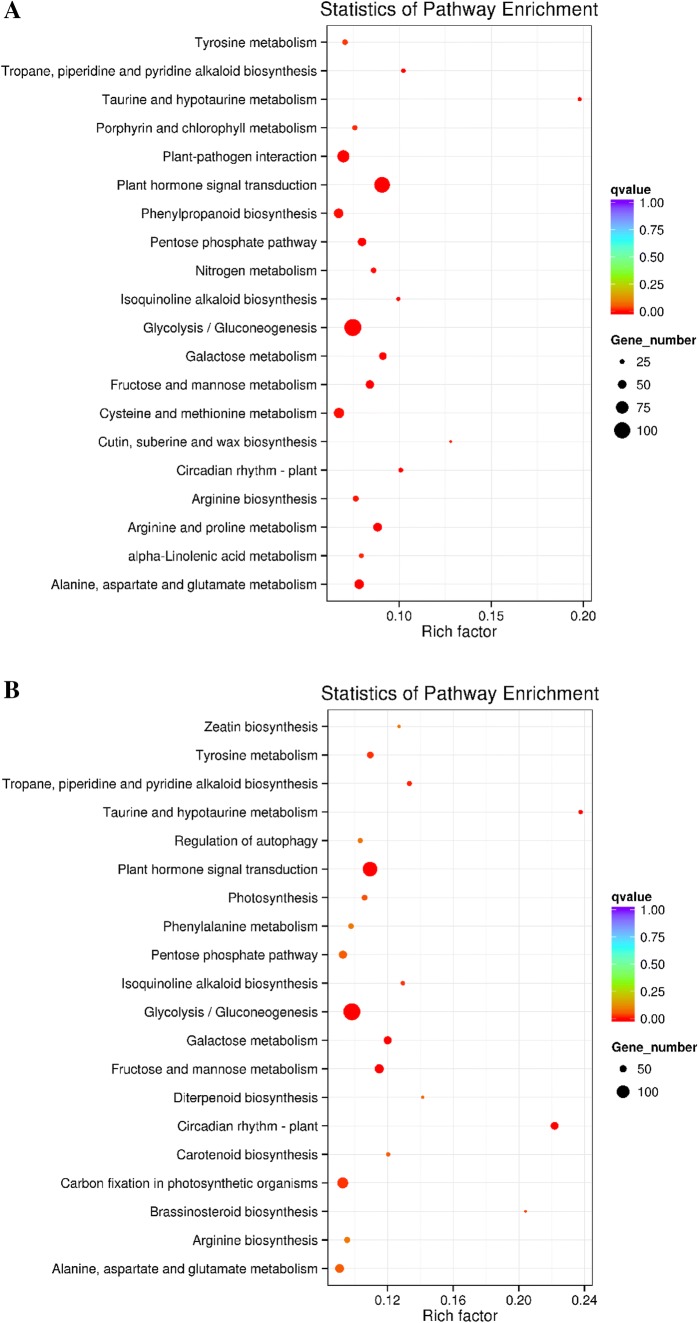
Fig. 4.
KEGG pathway enrichment analysis of stage 1 (A) and stage 2 (B). The top 20 enriched KEGG pathways are listed. The X-axis indicates the enrichment factor of the KEGG term, and the Y-axis indicates the name of the KEGG term. The size of the points indicates the number of genes within the pathway term. The colour of each point indicates the degree of enrichment (color figure online)

