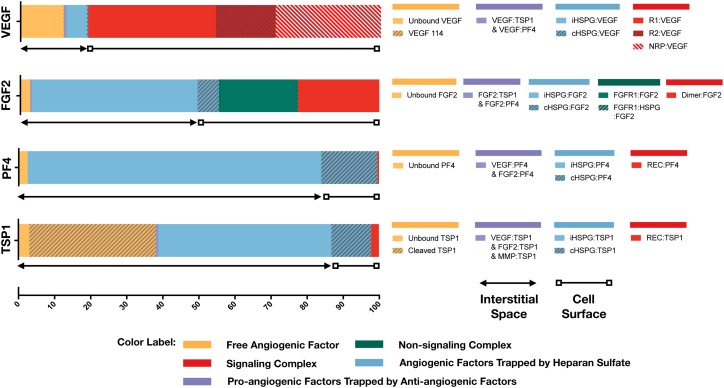
FIGURE 3.
Distribution of VEGF, FGF2, TSP1, and PF4 in tumor tissue at steady state. The percentages of each angiogenic species in its various forms are shown. Species are grouped and labeled with different colors. The sum of the forms bound to the cell surface or in the interstitial space is also indicated.

