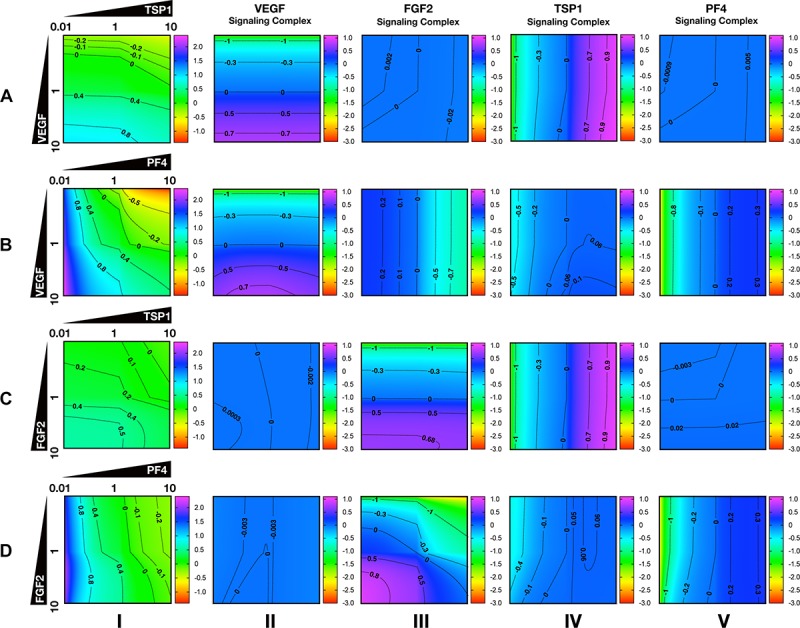
FIGURE 4.

Effects of secretion of angiogenic factors on the angiogenic state of the tumor tissue. Column I shows the angiogenic ratio in the log10 scale. Column II to V show the signaling complex levels (normalized to the baseline prediction) in the log10 scale. The value range is given by the colorbar. The horizontal and vertical axes of each subplot show the fold-change of the corresponding secretion rates, relative to their baseline values. The different rows show the effects of varying the secretion rates of different angiogenic factors: (A) VEGF and TSP1 secretion rates vary. (B) VEGF and PF4 secretion rates vary. (C) FGF2 and TSP1 secretion rates vary. (D) FGF2 and PF4 secretion rates vary. The predictions shown in the figures are based on the steady state of the system.
