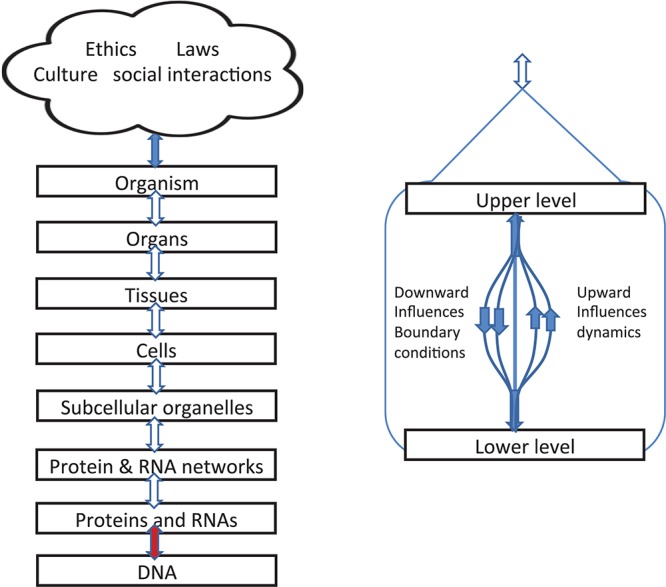
FIGURE 4.

Left: Representation of levels of interaction emphasizing that upward and downward causation operate simultaneously and are shown as double arrows. Right: diagram showing that, within each bidirectional causal arrow, there are different forms of causation, up and down.
