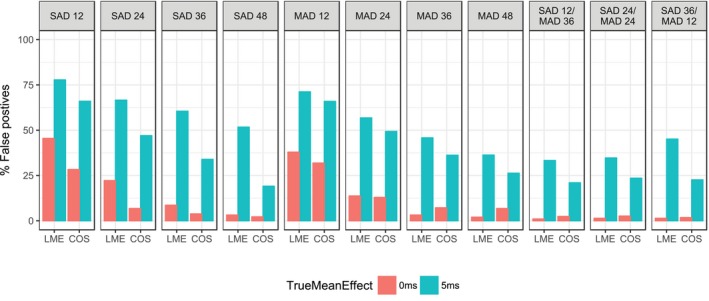
Figure 4.

Rate of false positive study outcomes when simulated with the cosine (COS) model and a true slope of 0 or 0.00081 ms/pg/mL (corresponding to an average increase in QTcF of 5 ms at the peak plasma concentration following twice‐daily dosing of 2.4 mg). The labels on each panel indicate the design (single‐ascending dose (SAD) or multiple‐ascending dosing (MAD)) and the number of participants. LME, linear mixed effect.
