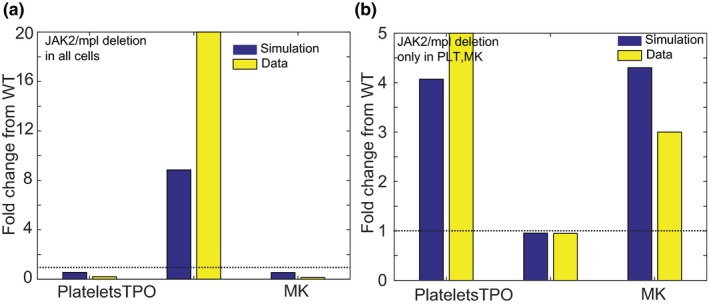
Figure 2.

Model shows changes in thrombopoietin (TPO), platelet (PLT) counts, and megakaryocyte (MK) counts qualitatively consistent with literature when the myeloproliferative leukemia virus oncogene (mpl) receptor is modulated in the MK lineage. (a) On deleting the mpl receptor in the entire MK lineage, model (blue) results in a decrease in PLTs and MKs with an increase in TPO levels in blood as seen in the literature (yellow). (b) In contrast, on reducing levels of expression of JAK2 or the mpl receptor in PLTs and MKs only, an increase in PLTs and MKs (blue, model; yellow, data) is observed with no substantial changes in TPO levels. This differential response to TPO with mpl receptor modulation is captured well in the model. As TPO and PLT levels are markedly different in mice and humans, this modeling exercise was to gain confidence in the structure of the model through qualitative comparison. JAK, Janus kinase; WT, wild type.
