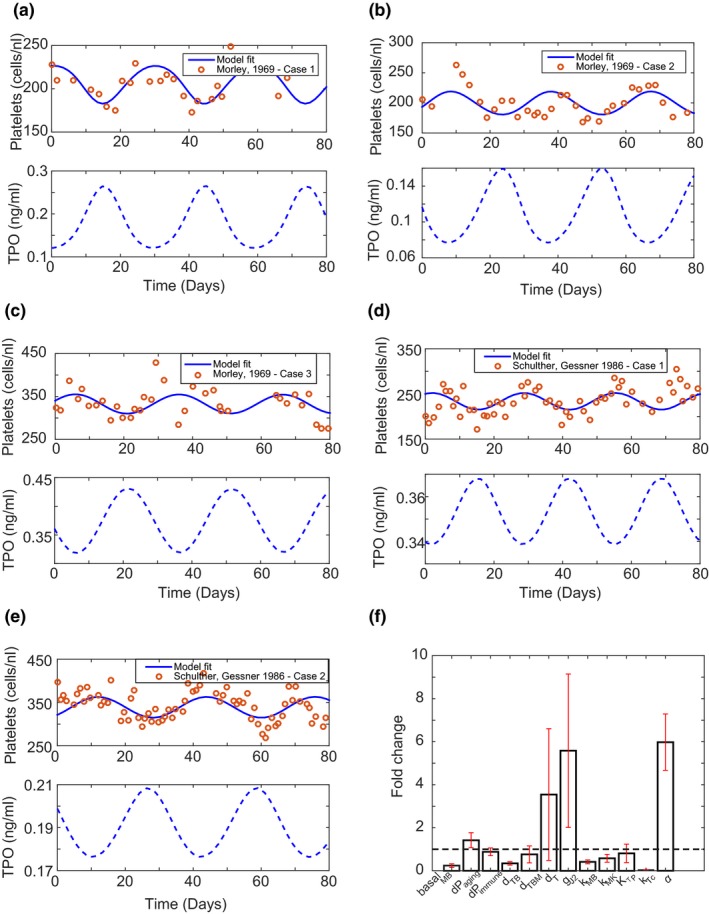
Figure 4.

Model structure can produce oscillations in platelet counts as seen in literature in some healthy individuals. (a–e) Model captures oscillations observed in healthy individual platelet counts and predicts corresponding thrombopoietin (TPO) levels. (f) Fold change in parameter values (see parameter definitions in Table S1) between the oscillatory and nonoscillatory state of the model. The sensitivity of megakaryoblast (MB) production to TPO levels (α) seems to be the important parameter for moving the system into an oscillatory state.
