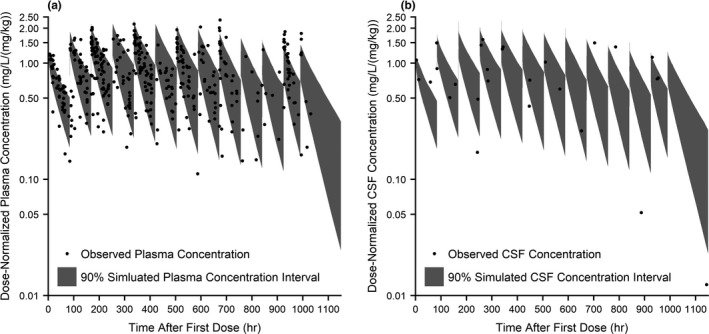
Figure 2.

Population simulations (n = 1,000) of plasma and CSF fluconazole concentration following prophylactic dosing (6 mg/kg twice weekly) in preterm infants. Population simulations of plasma (a) and CSF (b) are shown overlaid with observed time‐normalized and dose‐normalized data. The shaded regions are the 5–95% range in concentration from 1,000 simulated infants reflective of the prophylaxis study demographics. CSF, cerebrospinal fluid; hr, hour.
