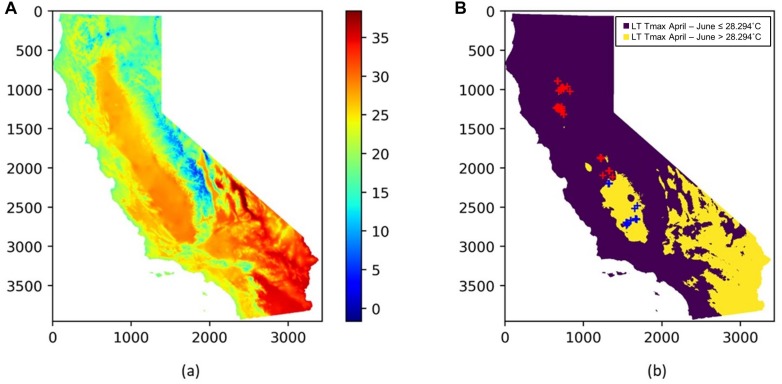
FIGURE 11.
(A) Spatial distribution of the long term mean Tmax from April to June (LT Tmax April–June); (B) locations of almond orchards in this study overlaid on top of a binary map of LT Tmax April–June with a threshold of 28.294°C; orchards with LT Tmax April–June < = 28.294°C (red cross); orchards with LT Tmax April–June > 28.294°C (blue cross); The binary long term mean April–June temperature map is shown in the background.

