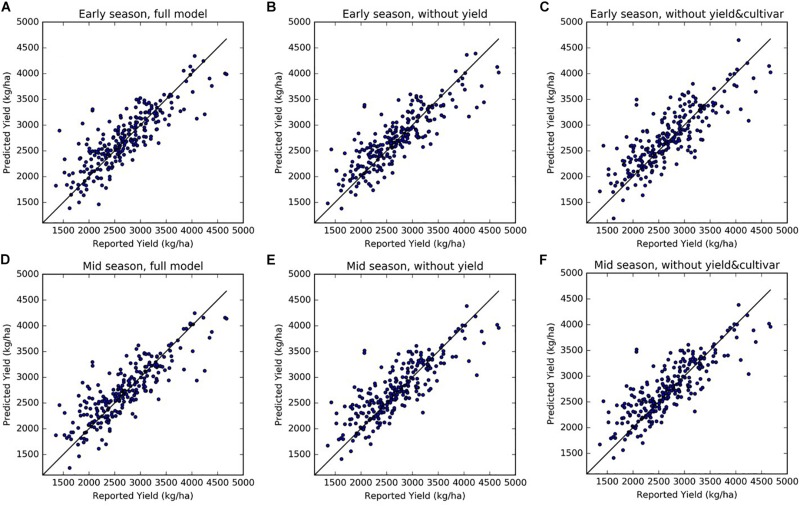
FIGURE 6.
Scatter plots of predicted vs. reported yields, from three sets of models for early season (top panels) and mid-season predictions (bottom panel): (A,D) full models, (B,E) reduced model excluding historical yields as predictors, and (C,F) reduced models excluding both historical yield and cultivar composition information. (A): Early Full; (B) Early NoYld; (C) Early NoYld-NoCul; (D): Mid-Full; (E) Mid-NoYld; (F) Mid-NoYld-NoCul. The predicted values shown here were from the reserved testing dataset in one round of the cross-validation (N = 247).

