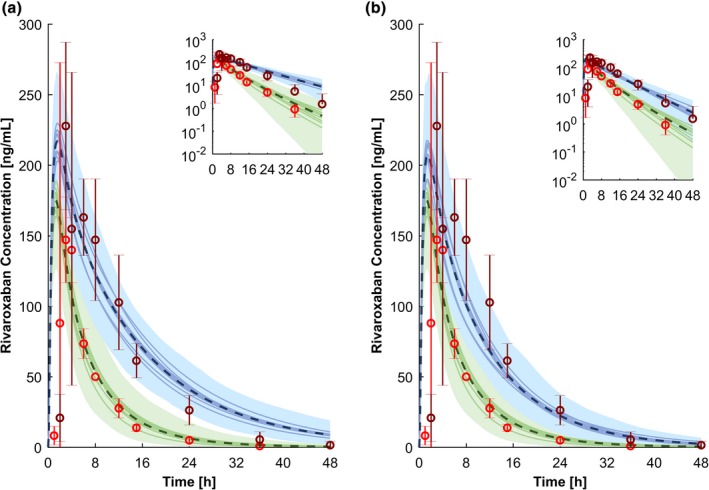
Figure 5.

Physiologically‐based pharmacokinetic simulations for a single dose of 10 mg rivaroxaban administered with 600 mg ritonavir twice daily in steady state (a) and 800/100 mg darunavir/ritonavir once daily in steady state (b). Green represents the prediction of rivaroxaban alone, and blue shows the prediction of rivaroxaban administered with the perpetrators. The dashed line and the shaded area are the mean and the 95% confidence interval for the prediction of all virtual individuals, respectively. The solid lines show the mean of each virtual trial (10 trials with 12 virtual subjects per trial have been simulated). The red and the dark red circles show the observed clinical data of 10 mg rivaroxaban alone and coadministered with 600 mg ritonavir twice daily.57 Conc., concentration; h, hour.
