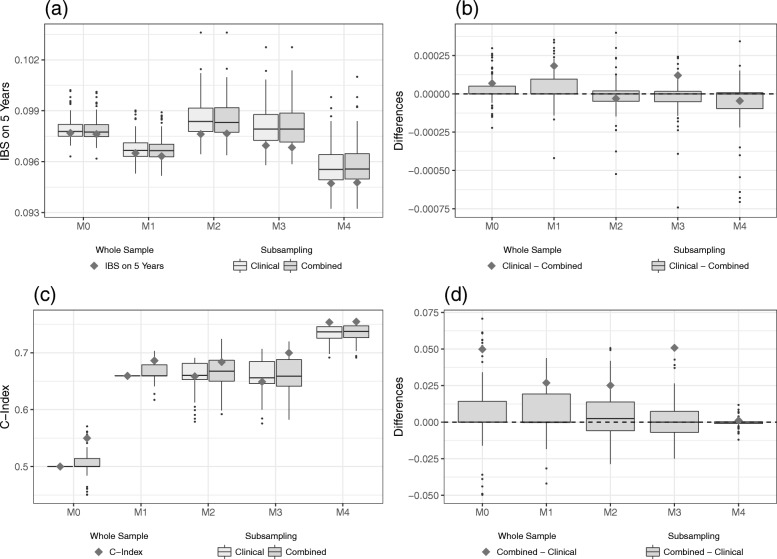
Fig. 4.
Results on the validation part of GDC data. IBS values (a) for the clinical and the combined models and the differences (b) between the models as evaluated on the validation data set. C-index values (c) for the clinical and the combined models and the differences (d) between the models as evaluated on the validation data set. The gray squares indicate the values of the models developed on the whole training data set, whereas the boxplots indicate the values obtained from the subsampling analysis. Two negative differences for model M4 are removed in (b)

