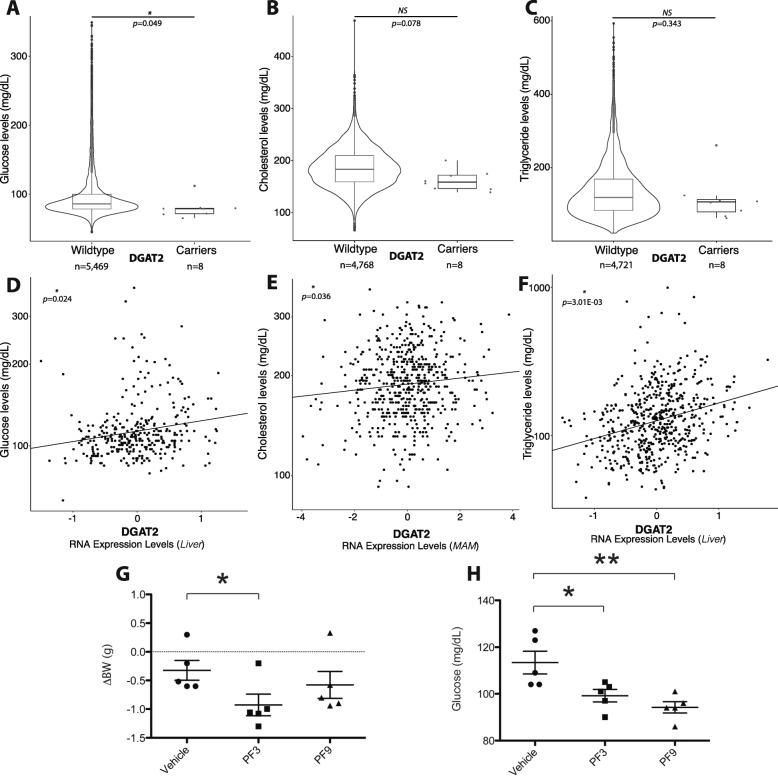
Fig. 4.
In silico analysis of DGAT2 and in vivo effect of selective DGAT1 and DGAT2 inhibitors on bodyweight and glucose levels in male C57BL/6 mice. a Significant association within the BioMe Biobank cohort between non-carriers (n = 5469) and carriers (n = 8) of LoF DGAT2 mutation on glucose level (logistic regression, see Methods; p = 0.049, β = − 19, tβ = − 1.4). b Association between non-carriers (n = 4768) and carriers (n = 8) of LoF DGAT2 mutation on cholesterol levels (logistic regression, see Methods; p = 0.078, β = − 24, tβ = − 1.8). c Association between non-carriers (n = 4721) and carriers (n = 8) of LoF DGAT2 mutation on triglyceride levels (logistic regression, see Methods; p = 0.34, β = − 26, tβ = − 1.0). d Association from STARNET RNA-clinical trait analysis comparing DGAT2 expression levels with glucose levels in liver tissue (p = 0.024, β = 0.56). e Association from STARNET RNA-clinical trait analysis comparing DGAT2 expression levels with cholesterol levels in mammary artery (p = 0.036, β = 0.089). f Association from STARNET RNA-clinical trait analysis comparing DGAT2 expression levels with triglyceride levels in liver tissue (p = 0.0030, β = 0.27). g Body weight loss (ΔBW) of chow-fed mice treated for 3 days with vehicle, DGAT1 inhibitor (PF3), and DGAT2 inhibitor (PF9). h Short fasting blood glucose of chow-fed mice treated for 3 days with vehicle, DGAT1 inhibitor (PF3), and DGAT2 inhibitor (PF9) (n = 5). p < 0.05 (*), p < 0.01 (**), versus vehicle (student t-test)

