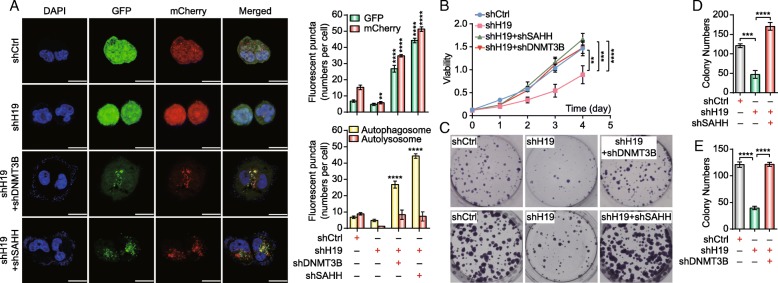
Fig. 5.
Tamoxifen resistance is regulated by the H19/SAHH/DNMT3B axis. a The distribution of autophagic vacuoles containing mCherry-EGFP-LC3 in MCF7/TAMR cells that stably expressed shControl (shCtrl), shH19, shH19+shSAHH, or shH19+shDNMT3B was analyzed by confocal microscopy. The bar graphs indicate the quantification of the fluorescent puncta data. The data are presented as the mean ± SD of three experiments. The scale bars indicate 20 μm. Two-way ANOVA was used for statistical analysis. b Under 10 μM tamoxifen treatment, the viability of MCF7/TAMR cells that stably expressed shCtrl, shH19, shH19+shSAHH, or shH19+shDNMT3B was analyzed using a CCK-8 assay. The data are presented as the mean ± SD of three independent experiments. Student’s t test was used for statistical analysis. c Representative images of the colony formation assays using MCF7/TAMR cells stably expressing shCtrl, shH19, shH19+shSAHH, or shH19+shDNMT3B under 10 μM tamoxifen treatment. d Bar graphs showing the quantification of the colony formation assays using MCF7/TAMR cells stably expressing shCtrl, shH19, or shH19+shSAHH. The data are presented as the mean ± SD of three independent experiments. Student’s t test was used for statistical analysis. e Bar graphs showing the quantification of the colony formation assays using MCF7/TAMR cells stably expressing shCtrl, shH19, or shH19+shDNMT3B. The data are presented as the mean ± SD of three independent experiments. Student’s t test was used for statistical analysis. **P < 0.01, ***P < 0.001, and ****P < 0.0001 compared with the control group

