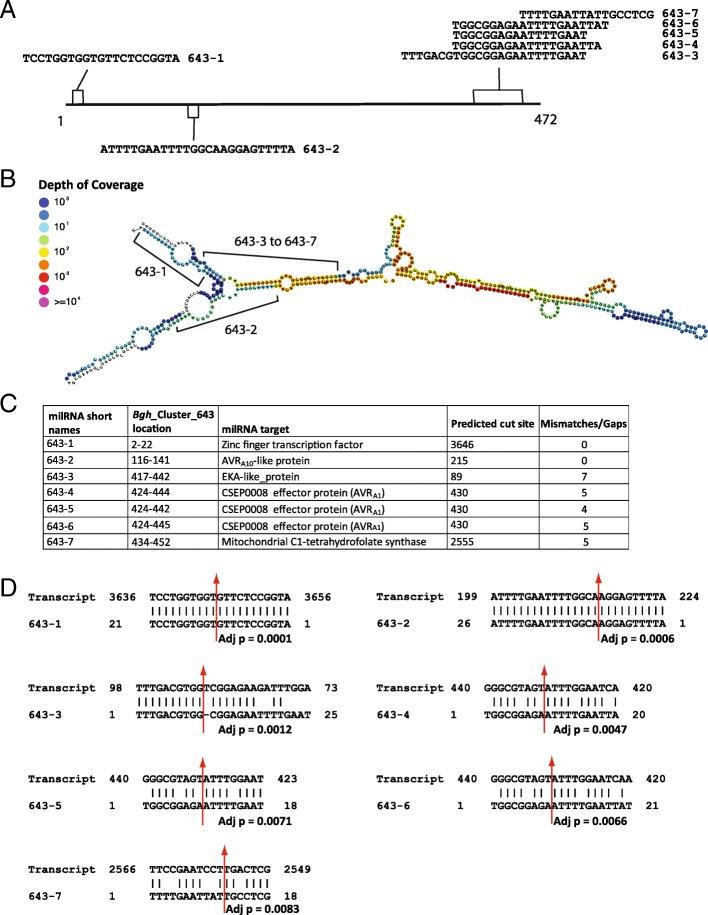
Fig. 2.
Bgh_Cluster_643 structure and encoded PARE-validated milRNAs. a Linear representation of Bgh_Cluster_643 with milRNA encoding regions for 643–1 to 643–7 highlighted. b RNAfold predicted Bgh_Cluster_643 structure with sRNA mapping density scale from blue (no coverage) to purple (> = 104 mapping reads) outputted from the ShortStack [34]. c Details of Bgh_Cluster_643 predicted milRNAs including name, location on Bgh_Cluster_643, predicted transcript target annotation, and number of mismatches/gaps in transcript alignment. Note that in Additional file 4: Table 2, Column “A”; lines 195–206 show the original designations from the ShortStack program, while simplified names used here are shown in parentheses. d Alignments of predicted milRNA to their transcript targets / cleavage sites with adjusted p values (detailed in Additional file 4: Table 2). Cleavage sites are represented by red arrows

