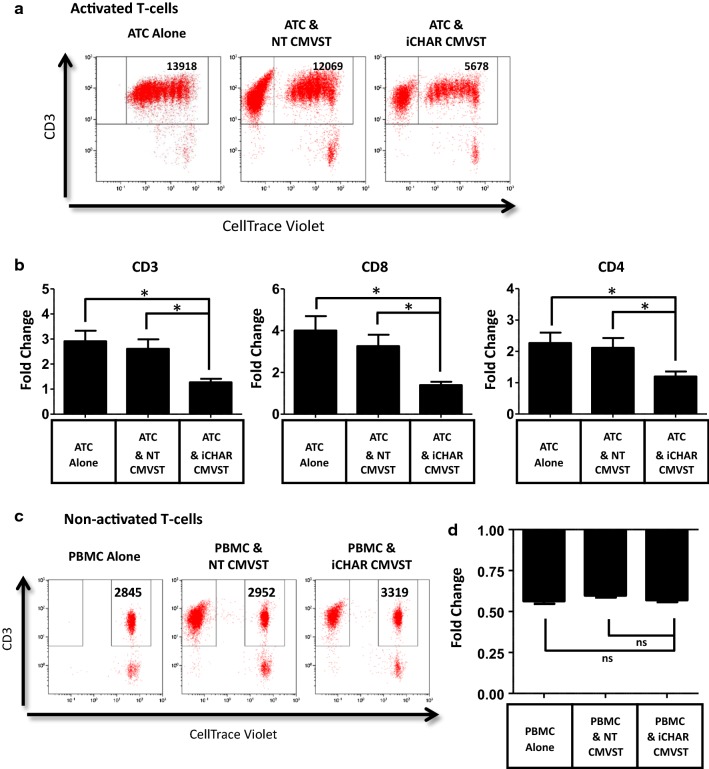
Fig. 6.
CMVSTs expressing iCHAR reduce expansion of activated T-cells but do not affect resting non-activated T-cells. a PBMCs labeled with CellTrace Violet were activated with antibodies to CD3 and CD28 for 4 h and then co-cultured with CMVSTs for 4 days. Representative dot plots of co-cultures from Day 4 showing cell counts of activated T-cells (ATC) assessed by counting beads. b Calculated fold change of gated ATC (CD3 + and CellTrace Violet+) from Day 0 to Day 4 (mean ± SEM, n = 3). c Non-activated PBMCs labeled with CellTrace Violet were co-cultured with CMVST for 4 days. Representative dot plots of co-cultures from Day 4 showing cell counts of non-activated T-cells. d Calculated fold change of gated non-activated T-cells (CD3+ and CellTrace Violet+) from Day 0 to Day 4 (mean ± SEM, n = 3). Significance was determined by paired two-tailed Student’s t-test. *p < 0.05 compared to iCHAR CMVST condition. ns not significant

