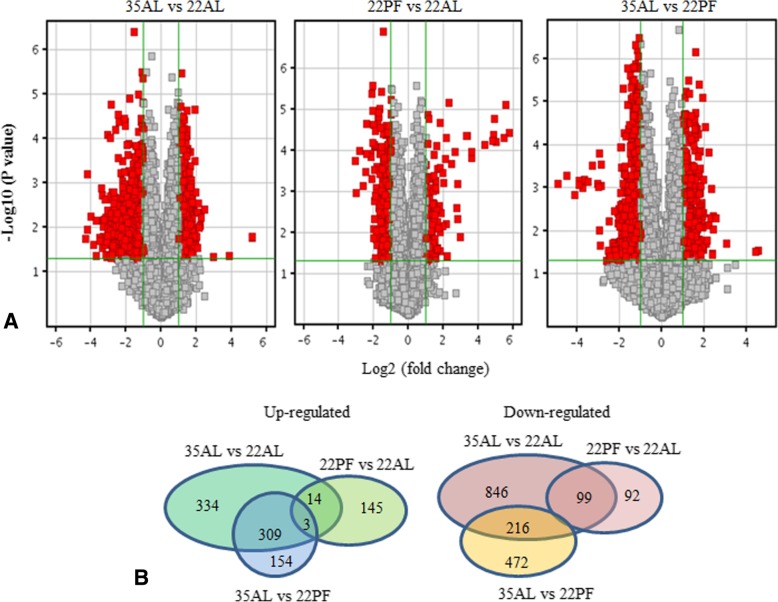
Fig. 1.
Differentially expressed genes in high temperature (35AL) vs. control (22AL), pair-fed (22PF) pigs vs. controls (22AL), high temperature (35AL) vs. pair-fed (22PF) pigs. a Volcano plot, red part stands for P value smaller than 0.05 and an average fold change (FC) of at least 2 in either direction. b Number of differentially expressed genes between treatments

