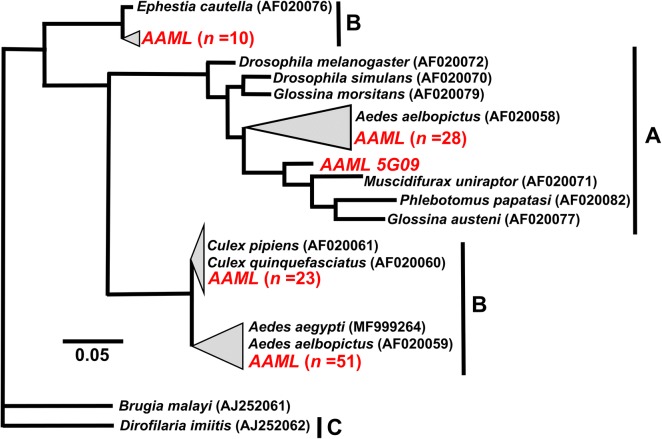
Fig. 2.
Phylogenic analysis based on wsp gene. The alignment was analyzed in PhyML. Sample sequences of Ae.aegypti collected in Metropolitan Manila are in red, labeled as AAML (Ae. aegypti Metropolitan ManiLa) and alphanumeric values indicate the unique code assigned to each Ae. aegypti individual sample. Merging (gray triangles) of sample and representative Wolbachia sequences was done to show degree of similarity (98–100%). Supergroups are indicated as A–C depending on the representative sequences used. The phylogenetic trees are re-drawn for better visualization; the expanded version is provided in Additional file 2: Figure S1. Please refer to Table 1 for the Wolbachia type sequences (ingroup and outgroup) for both markers

