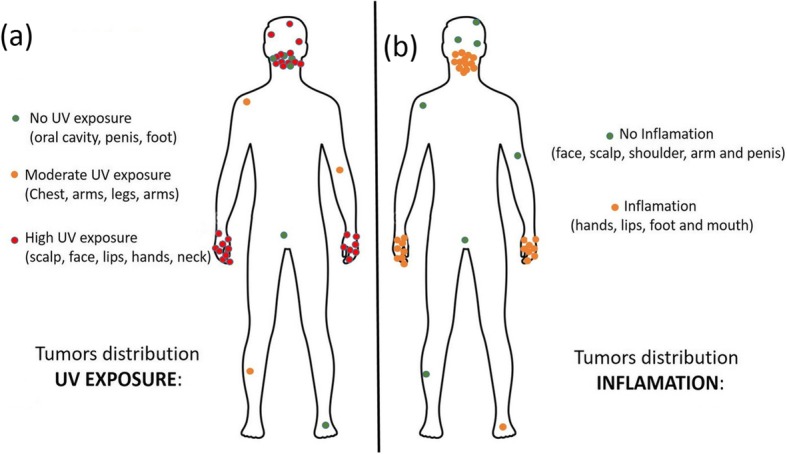
Fig. 2.

Representation of the body distribution of KS-SCCs. a The key color, classifies every tumor in different areas according to its´ UV exposure: Non-exposed (green), Moderately-exposed (orange) and Highly-exposed (red). b The key color, classifies every tumor in different areas according to whether the zone has been described as chronically inflamed in KS: no inflammation (green) and chronic inflammation (orange)
