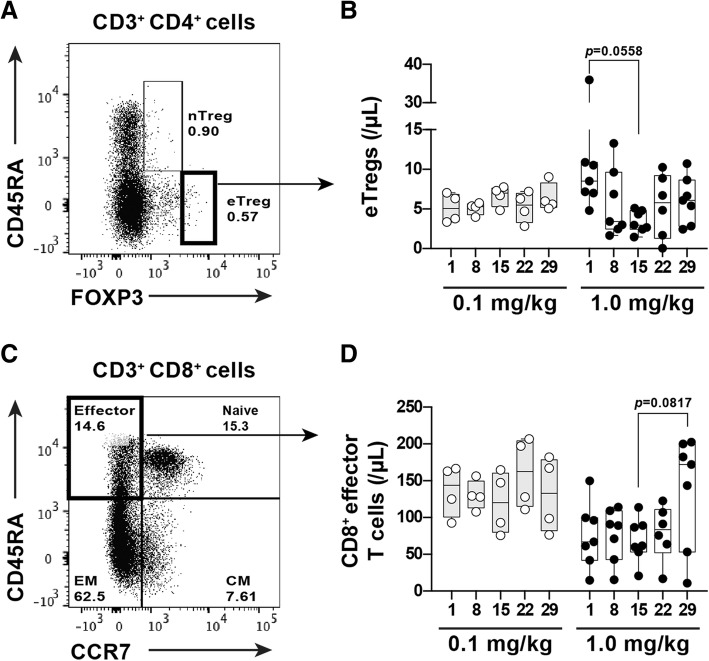
Fig. 2.
Kinetics of eTregs and effector CD8+ T cells in PBMCs after IT1208 administration a and c. The lymphocyte gating strategy for identification of eTregs (a) and effector CD8+ T cells (c) is indicated. The eTregs were identified as CD4+CD45RA−FoxP3high and effector CD8+ T cells were identified as CD8+CD45RA+CCR7−, respectively. b and d. Changes in eTregs (b) and effector CD8+ T cells (d), after infusion with 0.1 mg/kg (gray bar and circle point) and 1.0 mg/kg (white bar and square point) IT1208. In patients receiving 1.0 mg/kg IT1208, the number of eTregs tended to decrease (b; n = 7, Wilcoxon’s rank sum test, p = 0.0558); in contrast, effector CD8+ T cells tended to increase (d; n = 7, p = 0.0817); this did not occur at 0.1 mg/kg. The cell numbers are presented as Box and Whiskers plots. One-way ANOVA (using Prism7) was used to perform multiple comparisons of the means of cell numbers among the time periods

