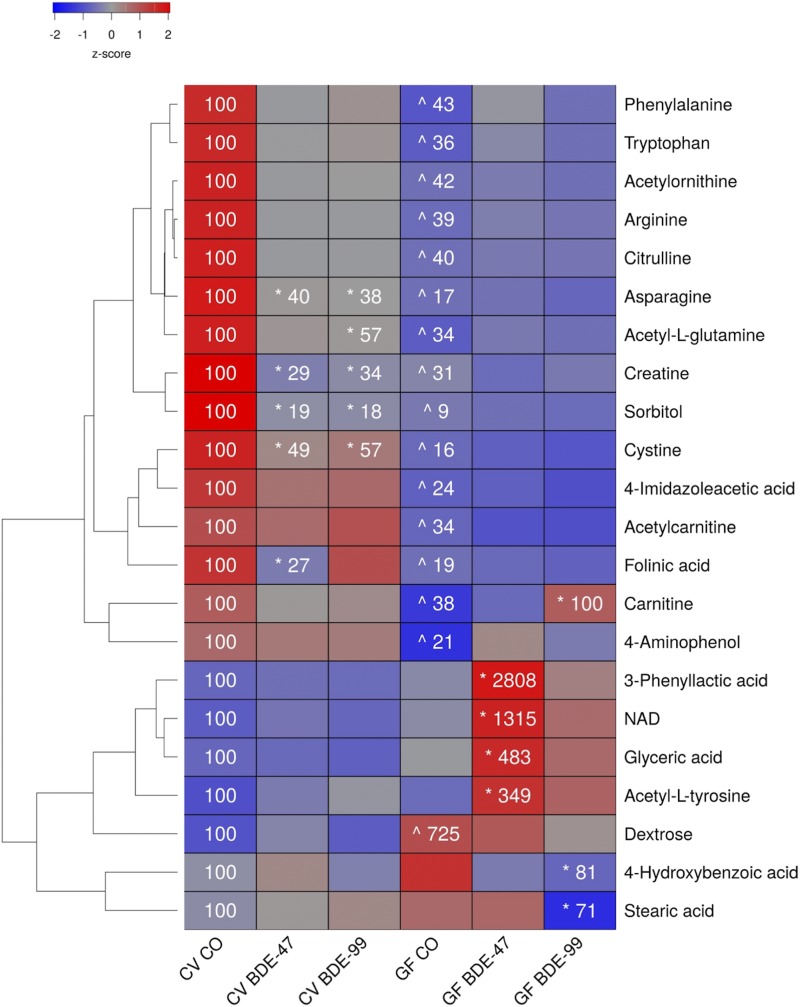
Fig. 3.
Two-way hierarchical clustering dendrogram of aqueous metabolites measured using LC-MS that were differentially regulated across treatment groups in SIC of GF and CV mice following exposures to BDE-47 and BDE-99. Euclidian distance and complete linkage were used to generate the dendrogram. Red indicates higher standardized treatment group mean metabolite relative abundances (z-scores) and blue lower. Asterisks (*) represent statistically significant differences between corn oil-treated and PBDE-treated groups within enterotype (adjusted P value <0.05, Tukey’s HSD post-hoc test). Caret signs (^) represent statistically significant baseline differences between CV and GF mice. Percent change from CVCO are shown for treatment groups with significant changes.

