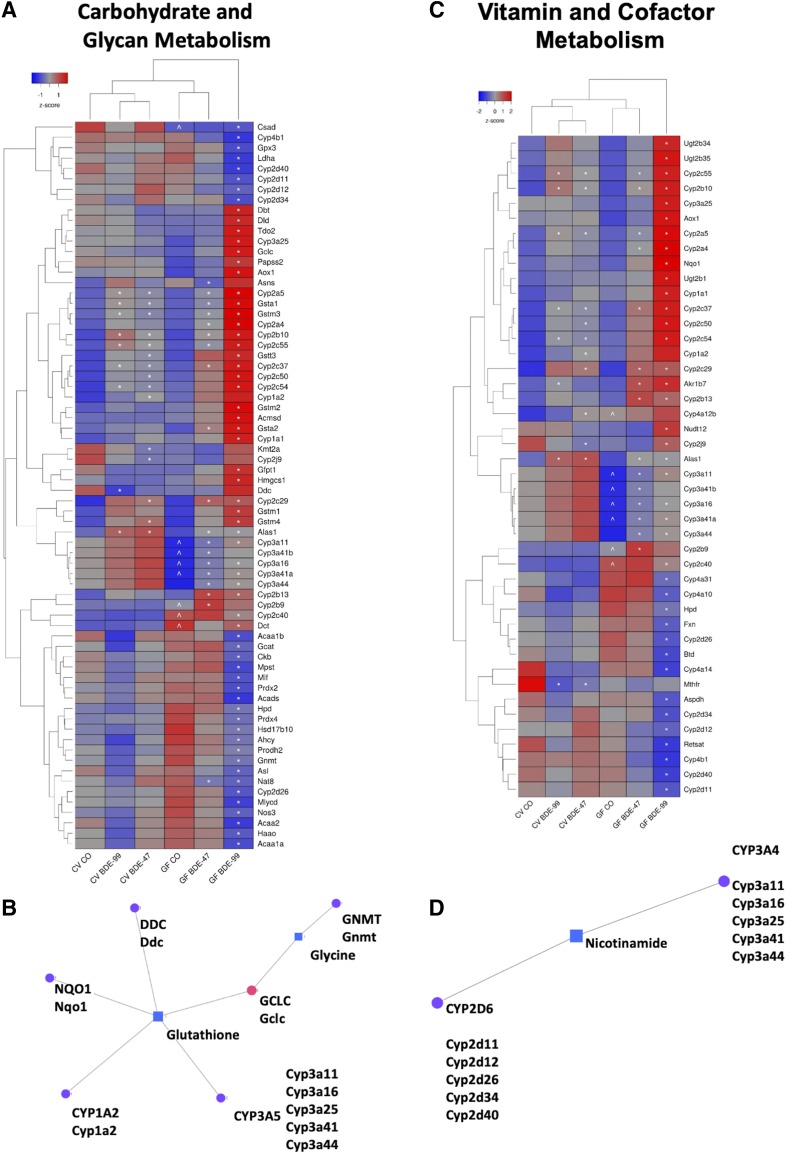
Fig. 6.
Two-way hierarchical clustering dendrogram of amino acid–metabolism genes that were differentially regulated across treatment groups in liver of GF and CV mice following exposures to BDE-47 and BDE-99 (A). Gene expression was quantified using RNA-Seq as previously reported (Li et al., 2017) and can be accessed through NCBI Gene Expression Omnibus (GEO; GSE101650). Euclidian distance and complete linkage were used to generate the dendrogram. Red indicates higher standardized mean metabolite relative abundances and blue lower. Network of differentially regulated amino acid metabolism genes [dopa decarboxylase (DDC), NQO1, GNMT, CYP1A2, and CYP3A5] (circles) and significantly altered aqueous metabolites (glycine and glutathione) (squares), which were measured using LC-MS, in liver (B). Mouse orthologs for human genes are listed in mixed case. Two-way hierarchical clustering dendrogram of vitamin and cofactor metabolism genes that were significantly altered across treatment groups in liver of GF and CV mice following exposures to BDE-47 and BDE-99 (C). Gene expression was measured using RNA-Seq as previously reported (Li et al., 2017) and can be accessed through NCBI GEO (GSE101650). Euclidian distance and complete linkage were used to generate the dendrogram. Red indicates higher standardized mean metabolite relative abundances and blue lower. Network of differentially regulated vitamin metabolism genes (CYP2D6 and CYP3A4) (circles) and the significantly altered aqueous metabolite nicotinamide (square), which was measured using LC-MS, in liver (square) (D). Asterisks (*) represent statistically significant differences between corn oil-treated and PBDE-treated groups (FDR adjusted P value <0.05). Caret signs (^) represent statistically significant baseline differences between CV and GF mice.

