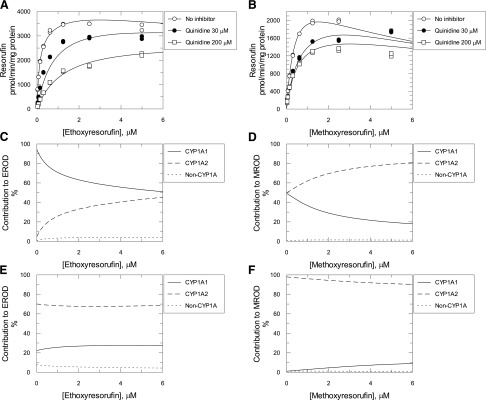
Fig. 6.
EROD and MROD activities measured in the presence or absence of quinidine in liver microsomes from TCDD-treated hCYP1A1/1A2 humanized mice. EROD (A) and MROD (B) with and without quinidine catalyzed by liver microsomes from TCDD-treated hCYP1A1/1A2 humanized mice. Symbols are the measured reaction rates. Lines are nonlinear regression analysis of the data using eqs. 7 and 8, respectively (for details, see Data Analysis in the Supplemental Materials). Contribution of CYP1A1, CYP1A2, and non-CYP1A components of the reactions were calculated using eqs. 9–14 (for details, see Data Analysis in the Supplemental Materials) for EROD (C and E) and MROD (D and F) with (E and F) and without (C and D) quinidine (200 μM).

