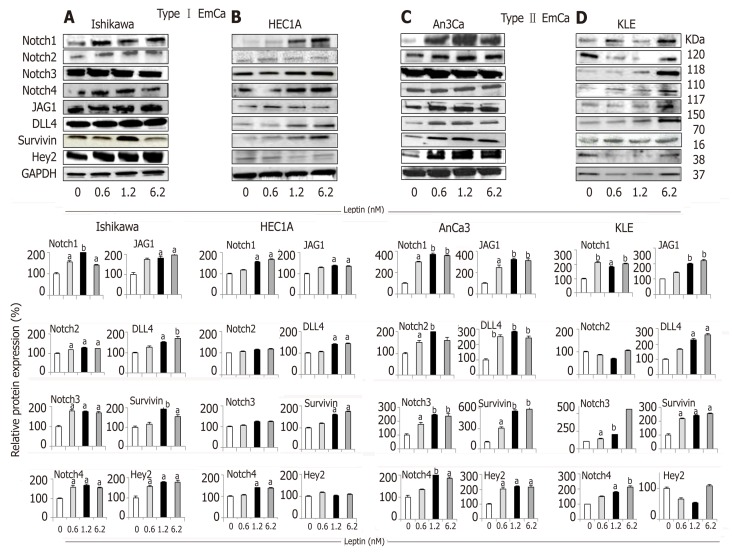
Figure 1.
Leptin-induced Notch protein expression in endometrial cancer cells. A-D: Representative results from Western Blot (WB) analysis of leptin dose-response effects on levels of Notch proteins in A and B [type I endometrial cancer (EmCa) cells] and B and C (type II EmCa cells). Leptin increases Notch protein levels (receptors: Notch1, Notch2, Notch3 and Notch4; ligands: JAG1 and DLL4 and targets: Survivin, Hey2) in type I EmCa (A, Ishikawa and B, HEC1A) and type II EmCa cells (C, An3Ca and D, KLE); Cells were cultured for 24h. Quantitative WB data (relative protein expression %) were calculated from densitometric analysis of bands with the NIH image program. The values were normalized to GAPDH as protein loading control. Data (mean ± SE) are representative results derived from a minimum of three independent experiments. aP < 0.05 and bP < 0.01 vs basal (no leptin).

