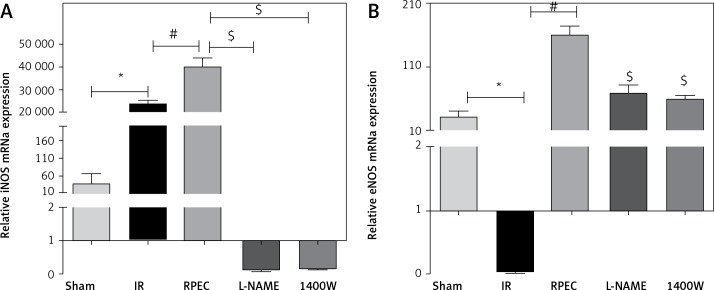
Figure 2.
Effect of RPEC on iNOS (A) and eNOS (B) expression in the kidney. Measurement of renal eNOS and iNOS gene expression at 24 h after reperfusion
IR – ischemia/reperfusion group, RPEC – remote per-conditioning group, L-NAME – nonspecific NOS inhibition + RPEC, 1400W – specific iNOS inhibition + RPEC. Each column and bar represent the mean ± SEM (n = 7). *P < 0.05 compared with the sham group; #p < 0.05 compared with the IR group; $p < 0.05 compared with the RPEC group.

