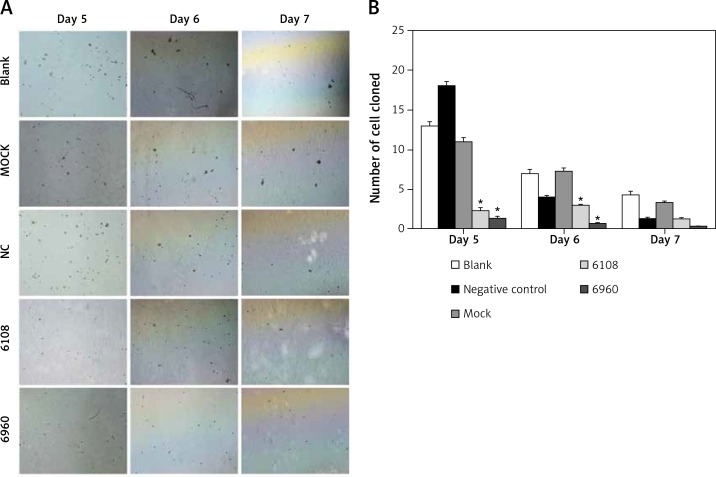
Figure 5.
Effects of MALAT-1 knockdown on anchorage- independent growth of SCC4 cells. A – Representative SCC4 cell colony growth in each group at days 5–7. B – Anchorage-independent growth of SCC4 cells (n = 3 per group). Data were presented as mean ± standard deviation. Comparisons between groups at each time point or between time points within a given group are all tested by analysis of variance. *p < 0.05, significantly different from the blank group

